This bridge condition information is provided for Oregon's local agency staff to report the condition of their jurisdiction's bridges in accordance with
HB 2017 legislation. Only National Bridge Inventory (NBI) structures are included. NBI structures are bridges or culverts that carry vehicular traffic and have an opening longer than 20 feet measured along the center of the roadway. This report contains data as of February 2024 and local governments can use the data to
report bridge condition information by the February 1, 2025 deadline.
Instructions
- You will enter information about the condition of your agency's bridges into the designated web-based reporting form by the February 1, 2025 deadline.
View a short video tutorial on bridge condition reporting.
- Every agency will need to complete a report, even if your agency owns zero bridges.
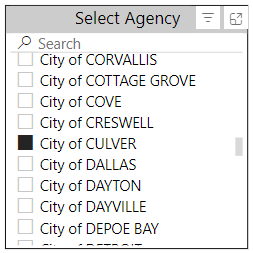
- In the interactive report below, begin typing your agency's name in the search box under "Select Agency".
- When you see your agency's name in the list, check the box next to your agency's name to filter the results to bridges that your agency owns.
- After selecting your agency, the map will display only the bridges your agency owns, and the color coding will indicate whether each bridge is in good, fair, or poor condition. If your agency does not own any bridges, the map will not show any dots.

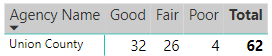
- After selecting your agency, the "Agency Name" table will display the number of bridges in each category. If your agency does not own any bridges, the table will show zero for each category.
- After selecting your agency, you can click "Details" to see a table with the rating of bridges your agency owns as well as the measures that contribute to that rating. Click "Summary" to return to the map view.


- If you prefer to review your data outside of the interactive report, download a Microsoft Excel version of all bridge inspection results by clicking the words "Open in Excel".

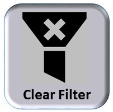
- You can clear selections in the report by clicking "Clear Filter".
- Contact the
transparency team with any questions.