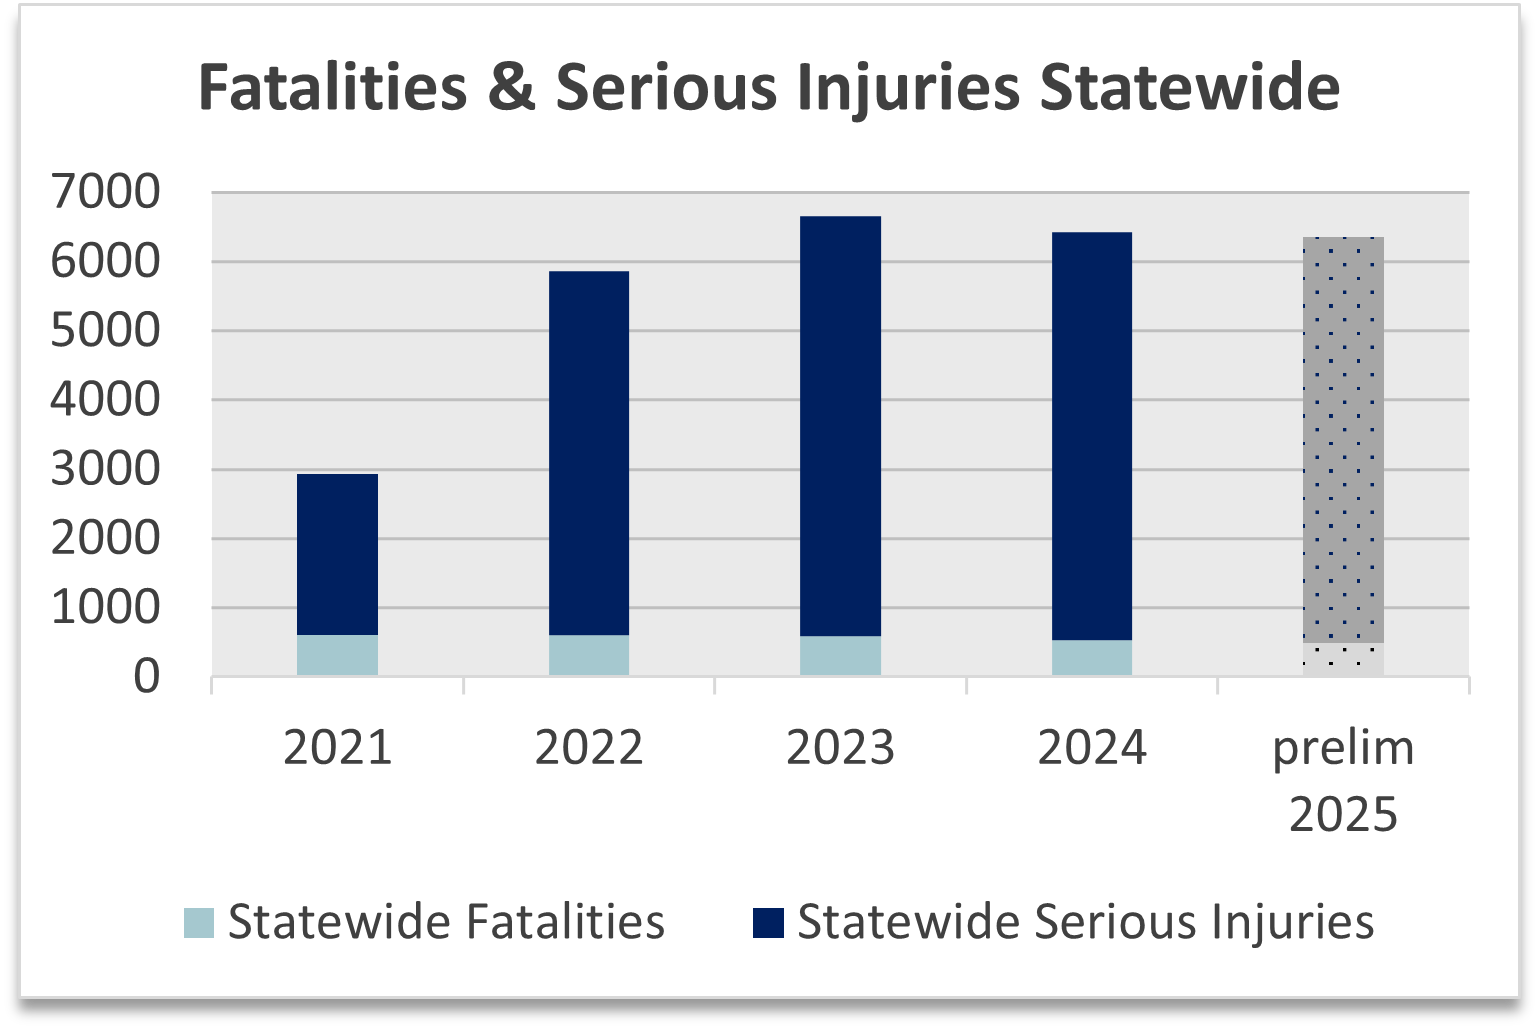
The number of serious injury crashes on Oregon’s roads has risen in recent years
While fatality rates have decreased in recent years, serious injuries from crashes have risen steeply, particulary on local roads near or at intersections.
- In 2023, 587 people were killed in crashes.
- 327 on ODOT Roads, 260 on local roads.
- In 2024, 539 people were killed in crashes.
- 304 on ODOT roads, 235 on local roads.
- Initial 2025 data shows that 487 people were killed in crashes.
- 265 on ODOT roads, 222 on local roads.
- Vulnerable users like pedestrians, bicyclists and motorcyclists are often involved in these types of crashes.
- Knowing this, we focus investments on improvements like roundabouts and pedestrian crossings.
Our ARTS program targets roadways with the highest potential for safety improvements statewide, but today's funding level cannot keep pace with these trends.
Source: ODOT Crash Data Systems (CDS): Updated 04/2026
Statewide, all types of crashes have increased
Intersections and lane or roadway departures are the most common contributing factors in fatal and serious injury crashes.
- We make system wide investments in rumble strips to help reduce lane or roadway departures, however roads in poor condition can't get this important safety treatment.
Speeding is a factor in 25% of fatal and serious injury crashes, and about one-third of those involve impairment.
More crashes occur in urban areas (58%) than rural areas (42%), with roadway departure, impairment, and aging drivers common in both.
Most crashes in urban areas occur at intersections.
- Many involve people who walk or bike.
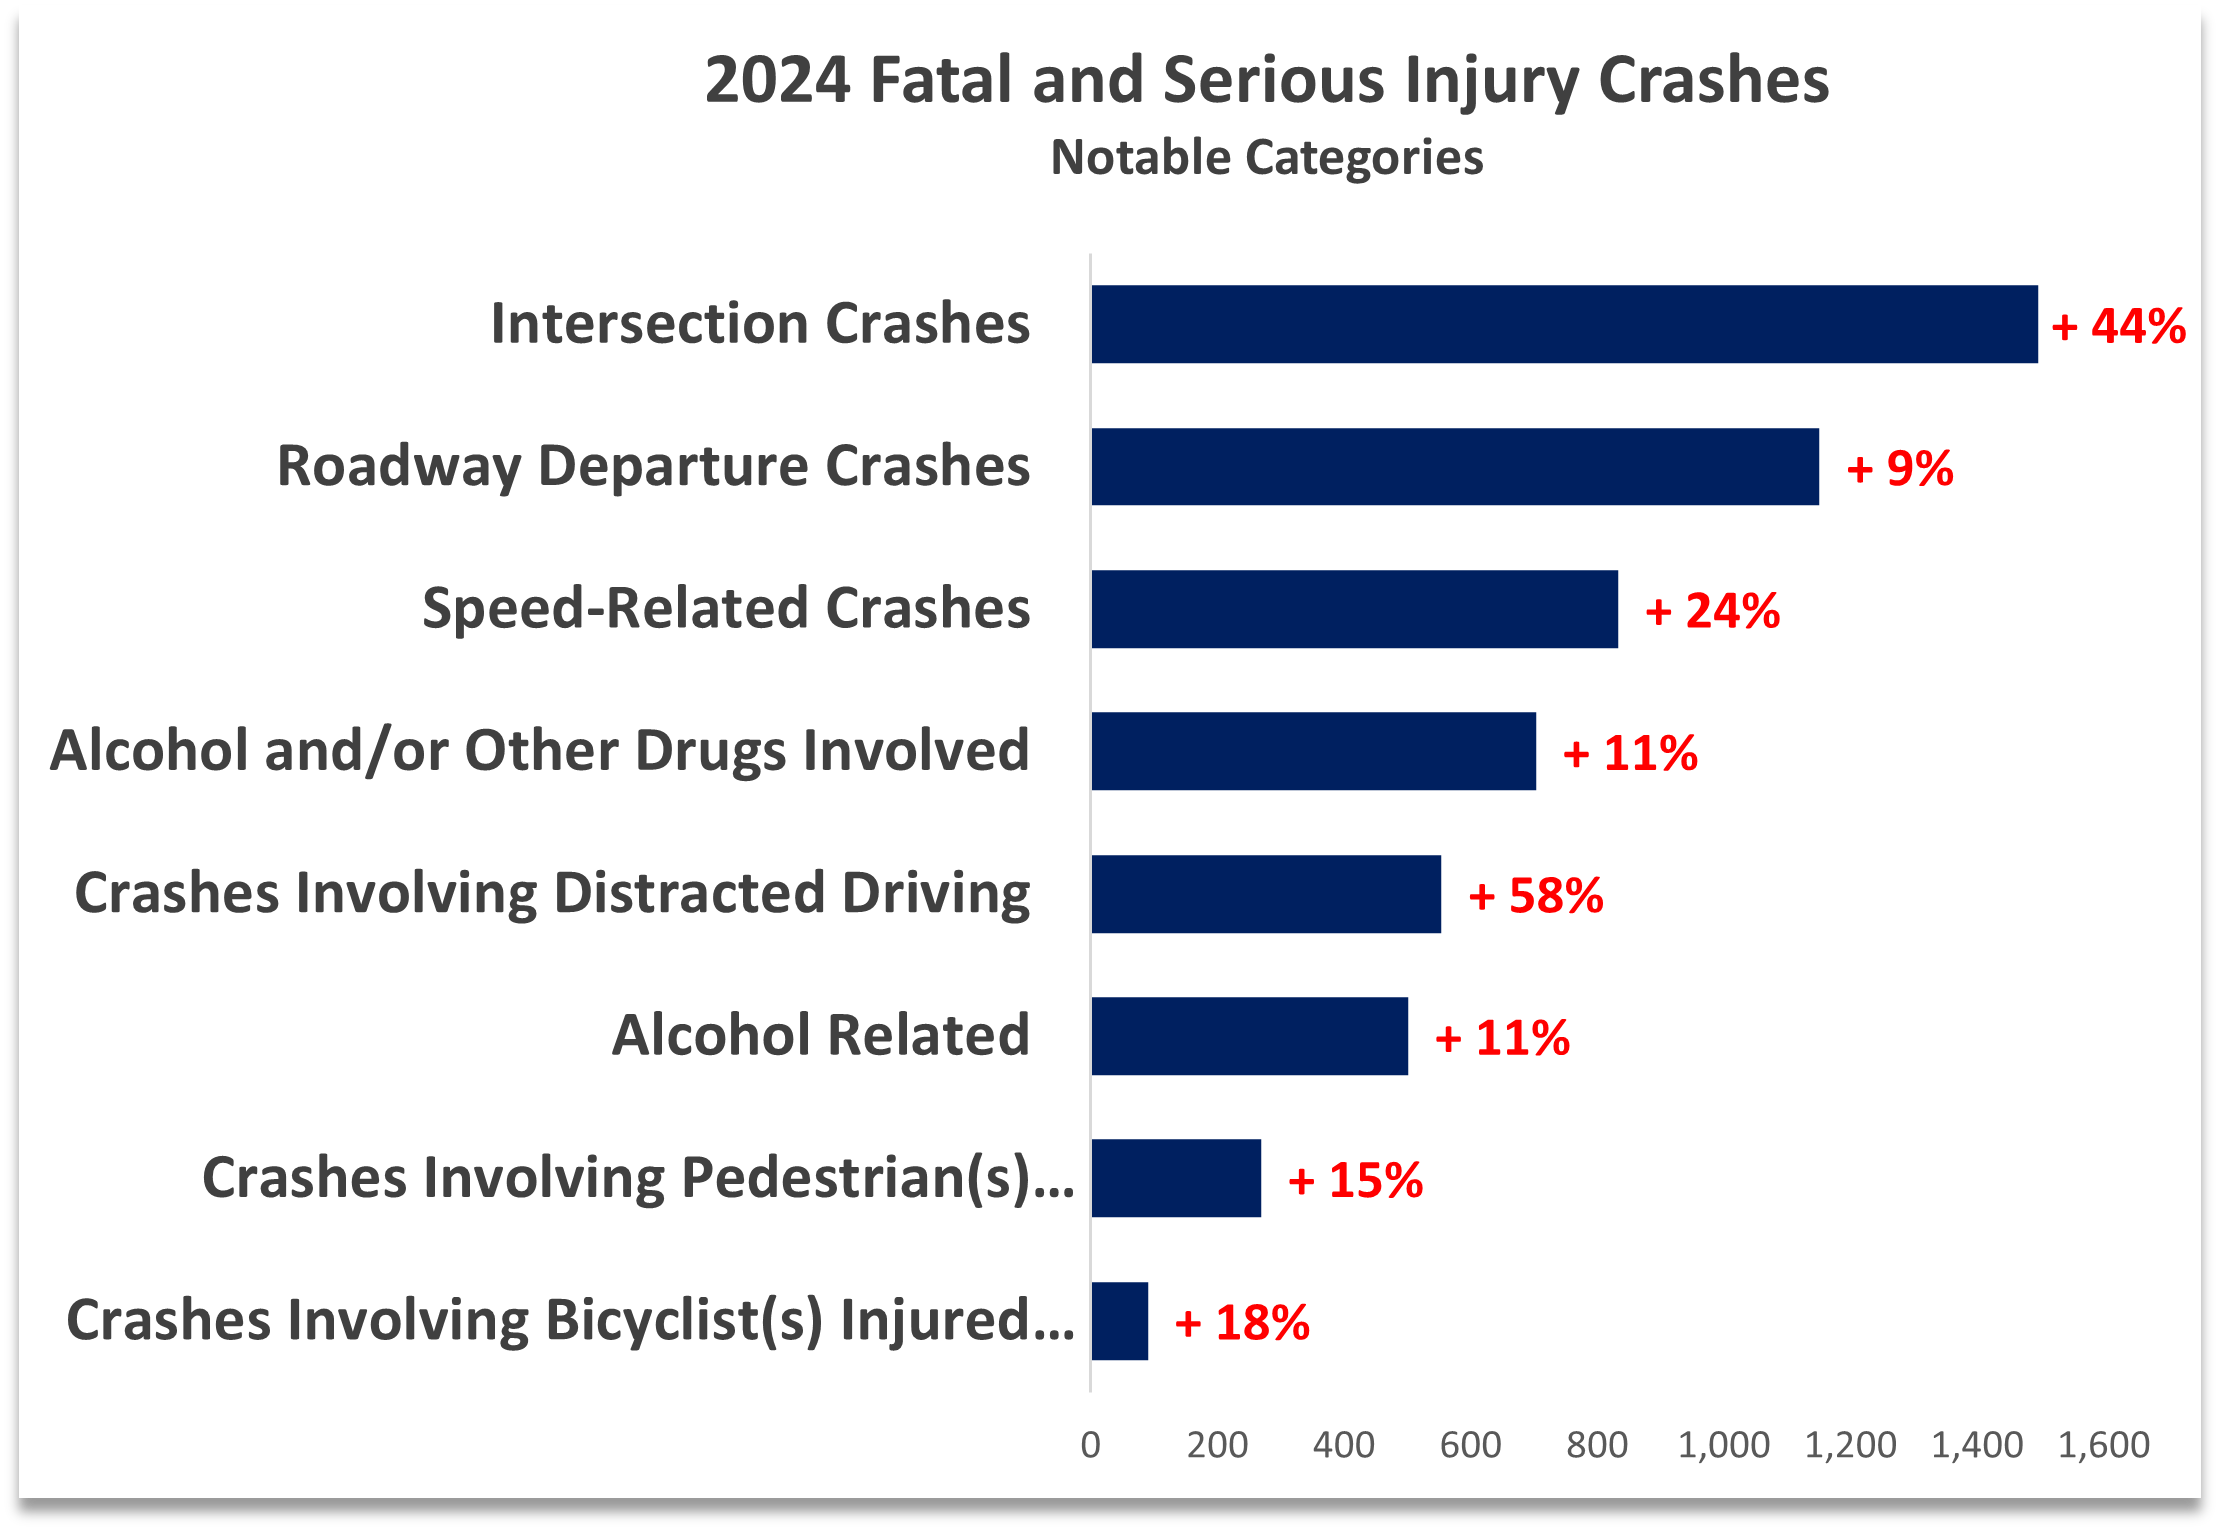
Click the chart to see more categories and data.
2024 Comparison of Fatal and Serious Injury Crashes by Category
Comparison to 2019-2023 average
Source: ODOT Crash Data System (CDS) Updated 04/2026
Pedestrian safety continues to be a serious issue
- There were 1.5 times more pedestrians killed in 2022 than the previous five-year average (126 deaths vs 80 deaths).
- While still high, the number of pedestrians killed each year has come down since then. (110 deaths in 2023 and 97 in 2024).
- We have created the Vulnerable User Crash Response program to investigate vulnerable user fatalities on state highways.
- We are now able to track these traffic deaths in real-time and report them on our
Initial Fatal Crash Information Viewer.
- Our research finds that in Oregon, Black and Indigenous populations are more likely to be killed walking on Oregon’s roads or sidewalks than White people. This is consistent with national trends.
- Recognizing these disparities, we are updating how we identify and select projects to close identified gaps.
Work Zone deaths are on the rise
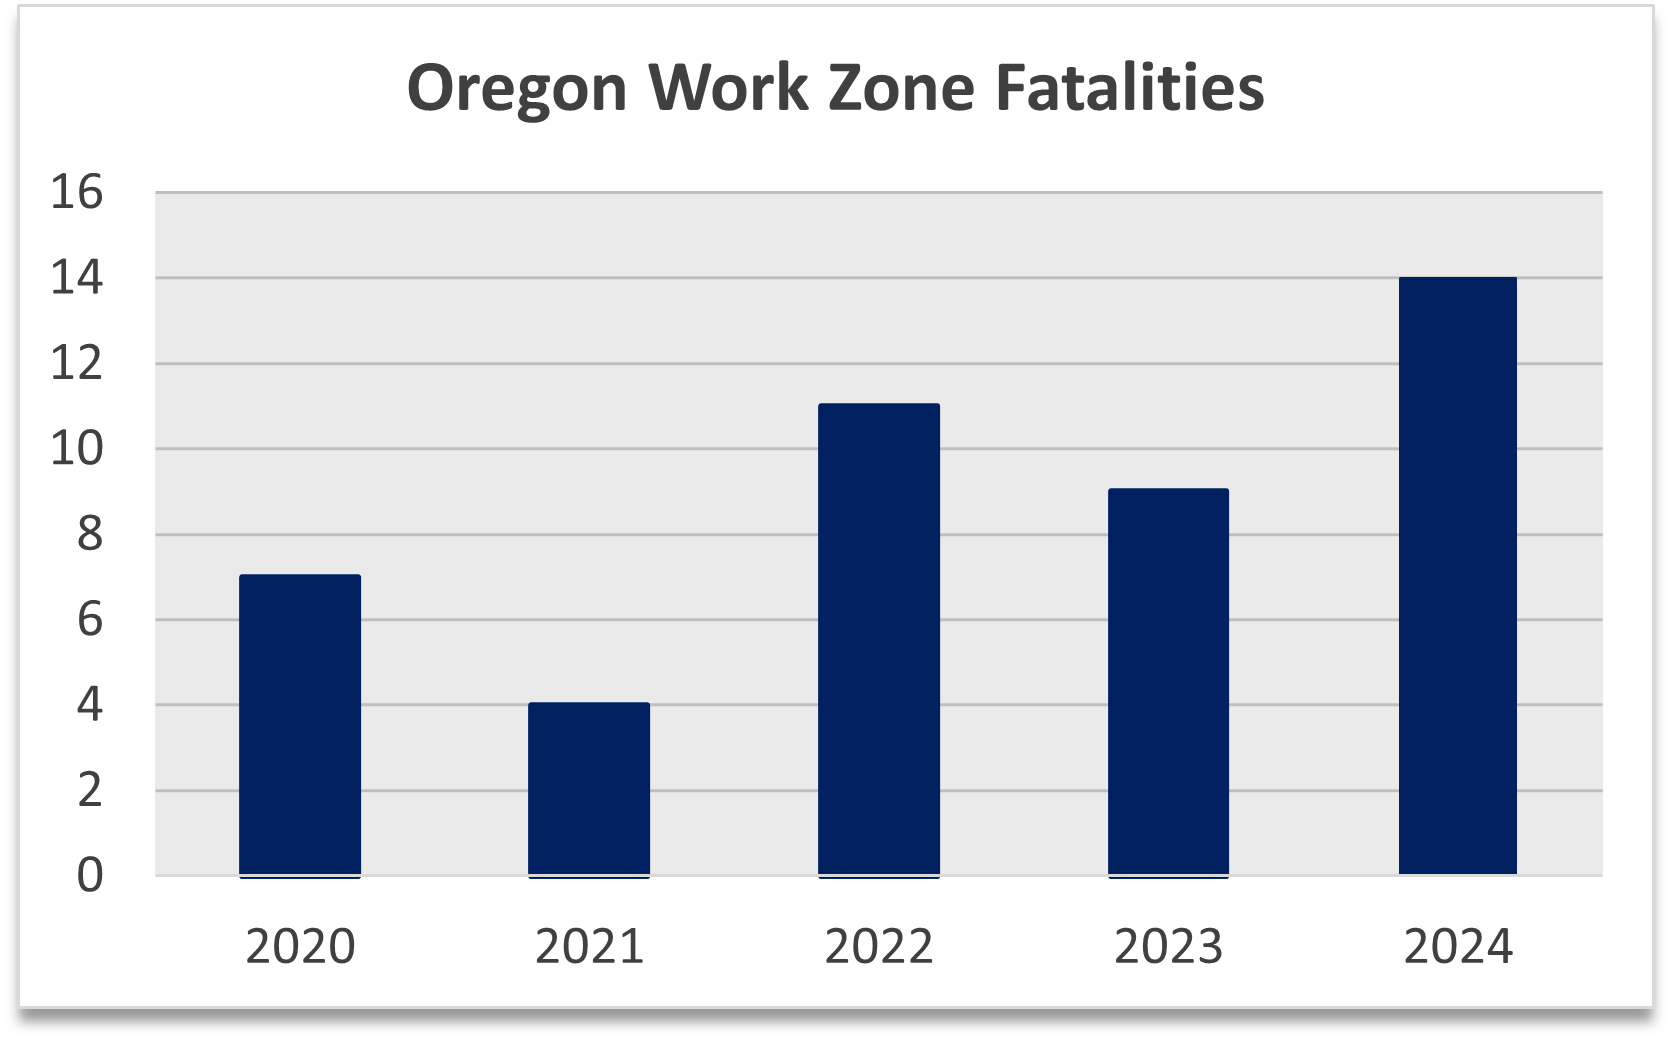 Work Zone Fatalities - Source: ODOT Crash Data System (CDS) Updated 04/2026
The number of fatalities occuring in work zones has increased in recent years. This is consistent with national trends.
We are exploring automated enforcement and other tools to keep workers safe and reduce work zone fatalities.
Screening freight truck drivers and inspecting their vehicles reduce crash rates
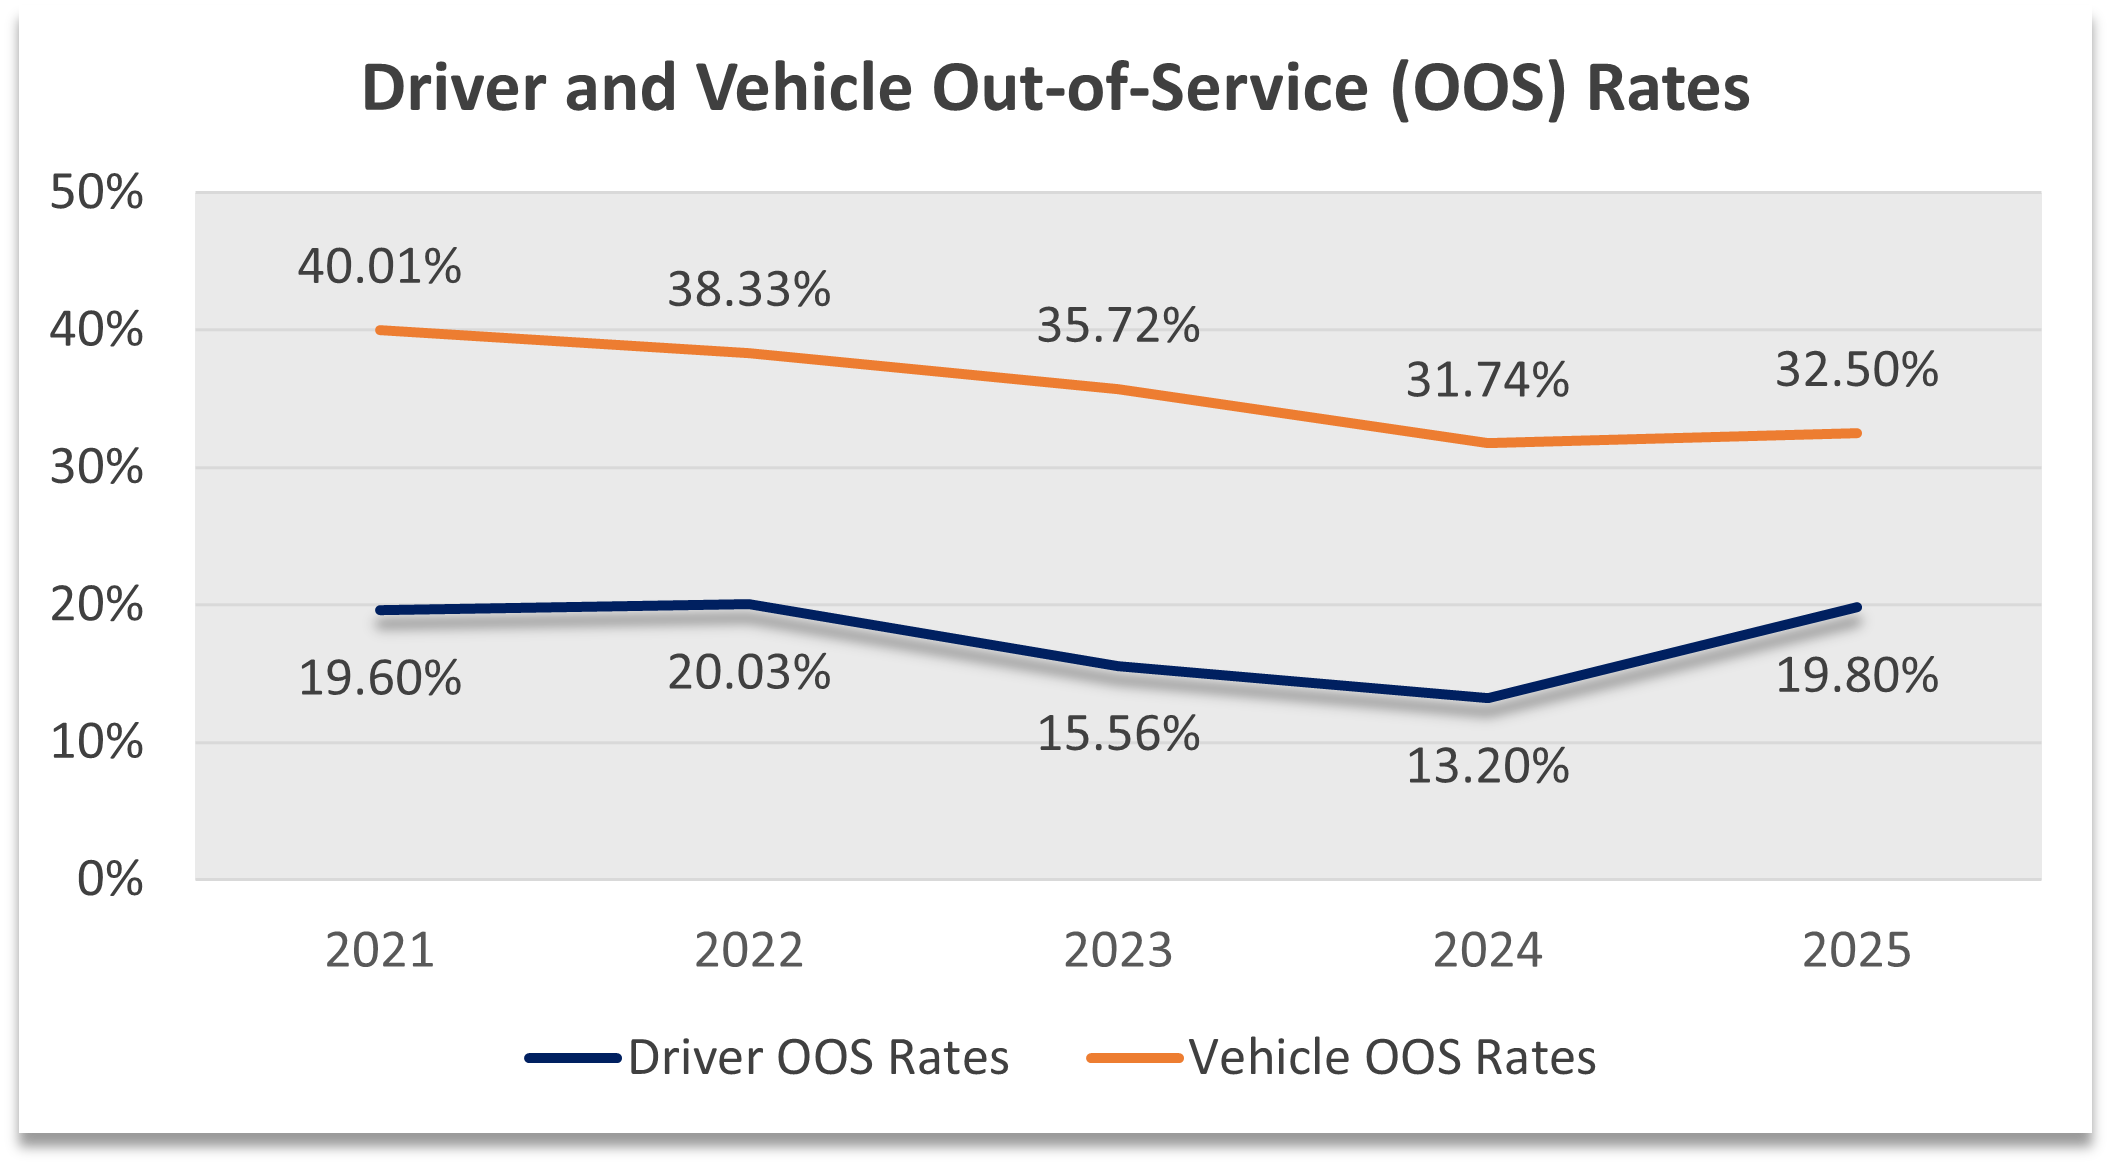
Source: ODOT Commerce & Compliance Division, Updated 02/2026
Wildlife crossings are needed to reduce wildlife-vehicle collisions
- Between 2021 and 2025 there were 25,969 wildlife-vehicle collisions reported, but these numbers are conservative.
- Wildlife crossings can help animals get to where they need to go without crossing roads, which reduces the chances of vehicle-wildlife collisions.
- In 2012 ODOT and our partners constructed the first dedicated wildlife undercrossing at Lava Butte along US 97. After monitoring between 2013 and 2018, cameras detected more that 32 species including black bear, cougar, elk, marmot, raccoon, coyote, deer, skunk, rabbit, turkey and bobcat.
- Wildlife-vehicle collisions have been reduced 86 percent along this four mile corridor.
- ODOT and our partners are ready to move on additional projects to create more wildlife crossings, but currently there is no dedicated funding for that work.
Visit our Transportation Safety Office website to learn more
To submit a question or comment: