PDF of full Hazards Viewer legend |
Page-size PDF with legend descriptions
Risk can be thought of as the intersection between hazards and assets. Assets is a term that encompasses all the things that make a community livable including the people, land use/zoning and buildings, critical facilities, and primary infrastructure such as transportation corridors, electrical transmission lines, dams, and so on. This map viewer shows state-owned buildings and public buildings.
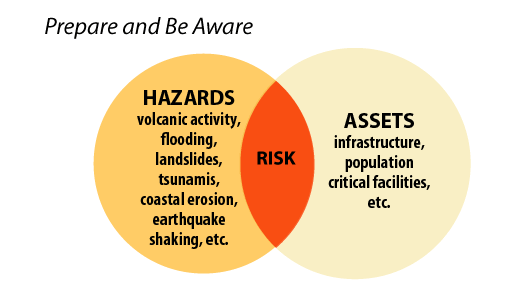 Image modified after Wood, N., 2011, Understanding risk and resilience to natural hazards: U.S. Geological Survey Fact Sheet 2011-3008, 2 p.
https://pubs.usgs.gov/fs/2011/3008/fs2011-3008.pdf
Image modified after Wood, N., 2011, Understanding risk and resilience to natural hazards: U.S. Geological Survey Fact Sheet 2011-3008, 2 p.
https://pubs.usgs.gov/fs/2011/3008/fs2011-3008.pdf
Hazards
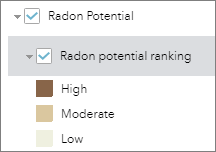
Radon Potential
Radon potential is the ability of rocks and soils to produce radon. Radon is a colorless and odorless gas, a radioactive byproduct of radium. This gas becomes a human health concern when radon makes its way from the building ground into structures. If radon builds up to high concentrations in indoor air, radon and its decay products can get trapped in the lungs through inhalation exposure. Long-term exposure to high radon levels may lead to lung cancer in some people.
The only way to determine radon levels accurately in individual buildings is by making measurements of indoor air. All residences regardless of location should be tested for radon. For more information on radon, go to
Radon Risk in Oregon, part of the Oregon Health Authority
Radon Gas website.
Types and Sources of Radon Data
There are four sources of data for the radon potential map, listed in order of importance, starting with most important source data:
Learn more about this layer:
DOGAMI Open-File Report O-18-01, Radon potential in Oregon
Intended Use and Data Limitations
The resolution of the data is 1:100,000 scale. The information was meant not to predict indoor radon test results but to help agencies target their radon program activities and resources. It is the user?s responsibility to examine the actual data and understand how the data apply to radon potential. Use of the map data also requires knowledge of local conditions and the application of professional judgment and common sense. Other limitations apply to the underlying geodatabase that produced the radon layer data:
- The data do not show or predict absolute indoor radon levels in buildings. Those levels are estimates in terms of an average indoor radon potential for the area of the geologic polygon. Other factors that are not trivial contribute to elevated indoor radon hazard potential in specific buildings, measures of which were beyond the scope of the study that produced the radon layer map.
- A radon hazard level may only cover a fraction of the geologic polygon?s area. The user should evaluate an area with caution and should always examine the actual data to gain a better perspective.
- Localized areas of higher or lower radon potential are likely to exist within any given geology polygon, but their identification is not possible because of scale, sparse data, or a combination of both.
- Hazard classifications are approximate and so are the underlying mapped boundaries (i.e., geologic polygons).
- The sample set of indoor radon tests is relatively small with spatial variations in sample sizes. Both introduce varying degrees of uncertainty. Therefore, more widespread and focused radon testing along with detailed geologic mapping would inform future radon potential maps.
Flood Hazard
Floods are a common and widespread natural hazard in Oregon.Flooding typically results from large-scale weather systems generatingprolonged rainfall and from ?rain on snow? events that cause large amounts ofsnowmelt.
In Oregon, these conditions are most common from Octoberthrough April when storms from the Pacific Ocean bring intense rainfall.Flooding can be aggravated when streams are altered by human activity, such asthrough channelization of streams or loss of wetlands. Wildfires can alsoincrease the likelihood of flooding by removing vegetation and increasingrainfall runoff. Many types of flood hazards exist in Oregon, includingriverine floods, flash floods (resulting from locally intense thunderstorms,ice jams and dam failures), coastal floods, channel migration and bank erosion,shallow area and urban flooding and playa flooding. Flood hazards can causesevere property damage and loss of life.
Effective FEMA Flood Data
The following FEMA datasets are periodically downloaded fromthe
FEMA Flood Map Service Centerto reflect the most recent effective flood data.
Floodway
The floodway, also known as the regulatory floodway, includes both theactive channel of a stream and the adjacent floodplain area that must be keptfree of development so that the 100-year flood discharge can pass through withoutincreasing the elevation of the 100-year flood by more than a designatedheight.
100-Year Floodplain
The 100-year floodplain is a flood zone developed by statistical analysesof stream discharge data to define the 1%-annual-chance flood event. The recurrence interval isbased on the probability that the given event will be equaled or exceeded inany given year.The resulting flood water surface is mapped on bestavailable topographic data, ranging from lidar (most accurate) to USGStopographic maps (least accurate). There is a 26% chance that a ?100-yearflood? will occur during the next 30 years.
500-Year Floodplain
The 500-year floodplain is a flood zone developed by statistical analyses ofstream discharge data to define the 0.2%-annual-chance flood event. The recurrence interval isbased on the probability that the given event will be equaled or exceeded inany given year. The resulting flood water surface is mapped onbest available topographic data, ranging from lidar (most accurate) to USGStopographic maps (least accurate). There is a 5-6% chance that a ?500-yearflood? will occur during the next 30 years.
More information:
FEMANational Insurance Flood Program.
Non-Effective Flood Data
The State Digitized dataset was published as a part of the ?OregonStatewide Flood Hazard Database ‘Oregon Statewide Flood Hazard Database - FEMA Flood Insurance Studies – 2015’ available for download on the
Oregon Spatial DataLibrary. When new flood maps have been digitized or adopted after 2015, the new data should be used instead of these datasets.
2015 State Digitized Flood Layer
The state digitized data were created by the Oregon Department of LandConservation and Development (DLCD) in 2015. They are a digital representationof flood zones shown on FEMA paper maps with minor modifications added by DLCD in order to more accurately reflect recent topography andstream reaches. This data cannot be used for regulatory purposes.
2015 FEMA Q3 Flood Layer
The FEMA Q3 data is a digital version of existing FEMA FIRM (FloodInsurance Rate Map) maps. However, it is generally inaccurate because it wascreated on poor topography source data and needs revision because of theoverall age of the data. The digital Q3 flood data are designed to provideguidance and a general proximity of the location of 100-year floodplain.
Data credits: Federal Emergency Management Administration(FEMA), Oregon Department of Geology and Mineral Industries (DOGAMI), and Oregon Department of Land Conservation and Development (DLCD), OregonGeospatial Enterprise Office (GEO).
Landslide Hazards
Climate, geology, and topography combine to make portions of Oregon landslide-prone. Precipitation, earthquakes, and human activity are the main triggers of landslides. Landslides are a significant natural hazard in Oregon, causing millions of dollars in damage annually. As the population vulnerable to landslides grows, greater losses are likely to result. To reduce the risk from future landslides, a variety of mitigation measures are required, all of which begin with an accurate and complete assessment of where landslide hazards exist. The first step in that hazard assessment is to inventory existing landslides and make that data easily accessible by anyone. The next step is to try to predict which areas are likely to have landslides in the future (landslide susceptibility).
In 2007, DOGAMI began to compile systematically all previously mapped landslides from geologic and hazard maps. This landslide compilation database, called the Statewide Landslide Information Database for Oregon (SLIDO), served as a starting point for all future landslide studies (Burns, 2007). 2) Research was performed to choose the best remote sensing dataset (i.e., aerial photos, photogrammetric elevation data, lidar [laser technology] elevation data, and so on) to use as a primary tool to begin systematic mapping of landslides in Oregon. The accuracy provided by lidar-derived elevation data was deemed necessary for understanding and mapping the landslide hazard in Oregon. This data is called a landslide inventory.
The other data shown here are landslide susceptibility data. A landslide susceptibility map shows modeled data that predicts the potential of a region or area to have landslides.
Detailed shallow landslide susceptibility: These data model the potential for landslides that involve movement of a relatively thin layer of slope material and have a shallow failure plane These are fine-grained, large-scale maps (1:8,000) and are thus intended for use at a local scale. This dataset is in raster format at a 3-foot (1-meter) resolution.
Detailed deep landslide susceptibility. These data model the potential for landslides that involve movement of a thicker layer of slope material. These are fine-grained, large-scale maps (1:8,000) and are thus intended for use at a local scale. This dataset is in polygon feature class format.
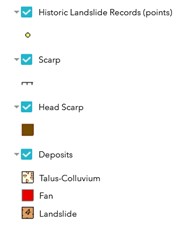
Landslide Inventory Data
-
Scarp flanks: This feature class represents polygons that delineate the head scarps and scarp flanks. These head scarps or uppermost scarps in many cases expose the primary failure plane (surface of rupture) and flanks or shear zones.
-
Scarps: This feature class represents lines of the uppermost extent of landslide head scarp and any internal scarps within the body of the landslide.
-
Deposits: This feature class consists of polygons delineating landslide deposits (including debris flow fans and talus extent).
-
Historic landslide points: DOGAMI compiled this data from several datasets including DOGAMI SP-34 (landslide points from 1996-1997). Each feature class dataset includes 29 fields. The dataset is a compilation of center points of published or known historic (roughly 1928-2018 in Oregon) landslides. Any available information about these landslides including damage and losses can be found in the attribute table.
Landslide Susceptibility
- Detailed deep landslide susceptibility: This layer is a deep landslide susceptibility map. The symbology on this map includes high, moderate, and low susceptibility. The deep susceptibility zones were established based upon location and proximity to deep landslide deposits and head scarps, buffer along the landslide head scarps, susceptible geologic units, slope angles, and mapper judgment following protocol developed by Burns (2008).
- Detailed shallow landslide susceptibility: This layer is a shallow landslide susceptibility raster dataset. The symbology on this map includes low, moderate and high susceptibility. The main components used to create the zones include 1) using a landslide inventory, 2) calculating regional slope stability factor of safety (FOS), 3) removing isolated small elevation changes (to reduce over-prediction), 4) creating buffers to add susceptible areas missed in a grid-type analysis (to reduce under-prediction), and 5) combining the four components into final susceptibility hazard zones.
Disclaimer
This product is for informational purposes and may not have been prepared for or be suitable for legal, engineering, or surveying purposes. Users of this information should review or consult the primary data and information sources to ascertain the usability of the information. This publication cannot substitute for site-specific investigations by qualified practitioners. Site-specific data may give results that differ from the results shown in the publication.
Reference:
Franczyk, J. J., Burns, W. J., and Calhoun, N. C., 2021, Statewide Landslide Information Database for Oregon, release 4.4 (SLIDO 4.4): Oregon Department of Geology and Mineral Industries, Digital Data Series.
https://www.oregongeology.org/pubs/dds/p-slido4.htm
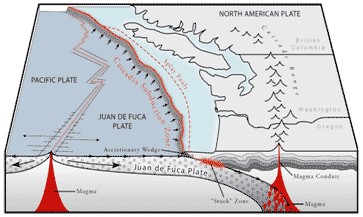
Cascadia Earthquake Hazard
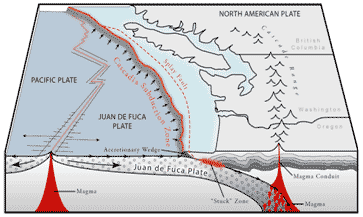
The Cascadia Subduction Zone (CSZ) is the tectonic plate boundary between the North American Plate and the Juan de Fuca Plate. These plates are converging at a rate of about 1.5 inches per year, but the movement is not smooth and continuous. Rather, the plates lock in place, and unreleased energy builds over time. At intervals, this accumulated energy is violently released in the form of a megathrust earthquake rupture, where the North American Plate suddenly slips westward over the Juan de Fuca Plate. This rupture causes a vertical displacement of water that creates a tsunami. Similar rupture processes and tsunamis have occurred elsewhere on the planet where subduction zones exist: for example, offshore Chile in 1960 and 2010, offshore Alaska in 1964, near Sumatra in 2004, and offshore Japan in March 2011.
A tsunami, often incorrectly referred to as a ?tidal wave,? is a series of waves that can travel great distances from their source and inundate coastal areas.The time of arrival of tsunami waves depends on a location?s distance from the source event. For example, tsunami waves from local earthquakes may arrive between 5 and 30 minutes after the earthquake has started. Waves generated by distant sources may arrive hours after the earthquake has occurred. Tsunamis pose a real threat to Oregon coastal communities from Cascadia Subduction Zone earthquakes and also from distant earthquakes near Alaska or Asia.
This viewer shows the estimated effects of a magnitude 9.0 Cascadia megathrust. The estimated chance in the next 50 years of a great subduction zone earthquake of this size is between 7 and 12 percent, assuming that the recurrence is on the order of 530 ? 260 years and that the last one occurred about 312 years ago.
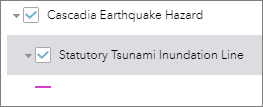
Statutory Tsunami Inundation Line
This line depicts the regulatory tsunami inundation boundary (Oregon Revised Statutes [ORS]
455.446 and
455.447) that was created by DOGAMI in 1995 to implement Senate Bill 379. It was created to prohibit the construction of new essential and special occupancy structures seaward of its location.
More information:
OregonTsunami.org/Tsunami Regulatory Maps
Data credit: Oregon Department of Geology and Mineral Industries (DOGAMI)
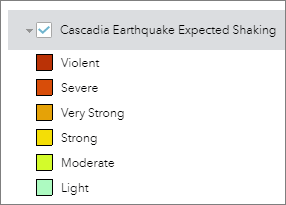
Cascadia Earthquake Expected Shaking
These data show the amount of shaking you can expect to feel if a magnitude 9.0 Cascadia Subduction Zone (CSZ) earthquake occurs. A CSZ earthquake will create a local tsunami that will inundate the Oregon coast.
More information:
OregonTsunami.org
Data credit: Oregon Department of Geology and Mineral Industries (DOGAMI)
Coastal Erosion Hazard
Coastal erosion is a complex process involving many natural and human factors. It is a chronic hazard along many areas of the Oregon Coast, especially sand spits, bluffed coastline, and dune-backed beaches.
Chronic hazards are clearly evident along Oregon?s shores and include beach, dune, and bluff erosion; landslides, slumps, gradual weathering of sea cliffs; and flooding of low-lying coastal lands during major storms. The damage caused by chronic hazards is usually gradual and cumulative. The regional, oceanic, and climatic environments that result in intense winter storms determine the severity of chronic hazards along the coast. The coastal erosion hazard threatens property in its path and, in extreme events, can threaten human life as well.
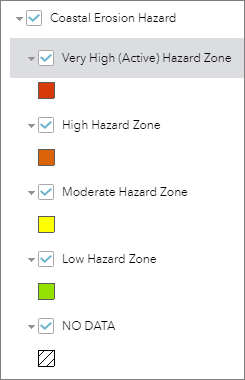
These hazard zones represent areas of low to very high (active) erosion of beach or dune sediments by wave action, tidal currents, or drainage. Oregon residents who own structures on or near a beach or bluff should be aware of this hazard and its potential impact. NO DATA denotes coastal areas not mapped.
Coastal Erosion Data Limitations and Notes for zones along bluff-backed shorelines:
- Erosion rates used to estimate widths of hazard zones are based on interpretation of relatively short historical series of aerial photography (1939 to present) and very limited lidar data acquired before 2008. Photos were georeferenced but not necessarily orthorectified and spatial locations may have considerable error.
- Low hazard zones incorporate hypothetical landslide block failures assumed to fail in the event of a M9 Cascadia Subduction Zoneearthquake. This may or may not happen.
- The moderate hazard zone is simply defined by half the distance between the high and low hazard zones for bluff-backed shorelines.
- Coastal erosion hazard zones have not been created for Lane, Douglas, and Coos Counties, and only partial data coverage exists for Curry County.
For more detailed information, please see the following
DOGAMI Publications used to create this hazard data layer: OFR O-01-03 (Tillamook County: Cascade Head to Cape Falcon); OFR O-01-04 (Clatsop County: Gearhart to Ft. Stevens); OFR O-04-09 (Lincoln County: Cascade Head to Seal Rock); OFR O-04-20 (Curry County: Sisters Rocks to North Gold Beach); OFR O-07-03 (Lincoln County: Seal Rock to Cape Perpetua); and OFR O-09-06 (Clatsop County: Seaside to Cape Falcon).
Data credit: Oregon Department of Geology and Mineral Industries (DOGAMI)
Volcano Hazard
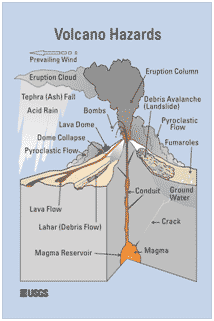
Volcanic eruptions are most likely to occur in the Pacific Rim states, which include Oregon. The primary danger area around a volcano covers an approximately 20-mile radius, although there is some danger to people within 100 miles or more. Airborne ash from a volcano can affect people hundreds of miles away from the eruption. The most common volcano-related hazards are ash (tephra), lahars (volcanic mud flows), lava and debris flows, avalanches, and pyroclastic flows.
These data depict areas where volcanic hazards may occur during or after volcanic activity. Volcanoes can produce volcanic ash, mudflows, debris flows, avalanches of hot volcanic material, lava flows, and landslides. Residents and visitors to these areas should have an evacuation plan ready should volcanic activity begin.
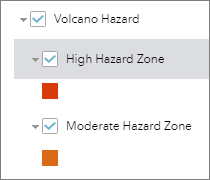
DOGAMI used data from the U.S. Geological Survey (USGS) Cascades Volcano Observatory (CVO) for this web application. CVO maintains proximal and distal hazard zone data for five volcanic areas in the Western Cascades of Oregon. These areas include Mount Hood, Crater Lake, Newberry, Mount Jefferson, and the Three Sisters. HazVu shows these data as two hazard zones: the high hazard zone (proximal zone) and moderate hazard zone (distal zone). Any person or structure located within these hazard zones should have an evacuation plan ready should volcanic activity begin.
More information:
USGS Cascades Volcano Observatory or
DOGAMI/Mount Hood Risk Study
Data credit: U.S. Geological Survey Cascades Volcano Observatory (USGS CVO).
Earthquake Hazard
An earthquake is a sudden movement of a fault in the earth's crust, abruptly releasing elastically-stored energy that has accumulated over a long time. The movement along the fault produces waves of strong shaking that spread in all directions. If the earthquake occurs near populated areas, it may cause many deaths and injuries, and extensive property damage. Earthquake hazards in Oregon are related to the Cascadia subduction zone megathrust fault along western Oregon and smaller faults distributed in the crust throughout the state.
Oregon is affected by the Cascadia Subduction Zone where the Juan de Fuca plate slides underneath the North American plate along a huge fault (see the figure below). The two tectonic plates are converging at a rate of about 1.5 inches per year, but the movement is not smooth and continuous. Rather, the plates lock in place, and unreleased energy builds over time. At intervals, this accumulated energy is violently released in the form of a megathrust earthquake rupture, when the North American Plate suddenly slips westward over the Juan de Fuca Plate. Extremely large earthquakes along this giant fault zone occur on average every 480 to 505 years, and smaller earthquakes occur ~220 years on average along the southern third of the zone. The most recent earthquake was January 26, 1700 CE, with a likely moment magnitude of 9, rupturing much of the subduction zone. For more information, see this
factsheet.
Oregon is also underlain by a large and complex system of faults that can produce damaging earthquakes. Although these smaller faults produce smaller earthquakes, they are often close to populated areas and damage can be great to structures nearby.
The many hazards related to earthquakes include: damaging shaking (which is amplified by some near-surface geologic conditions), rupture of the ground along the surface trace of a fault, liquefaction of areas with particular sediment and groundwater characteristics, tsunami waves in coastal areas, and earthquake-triggered landslides. While surface fault rupture can produce damage to facilities and infrastructure astride the fault, losses from this are typically minor compared to those resulting from strong ground shaking and associated ground failures. The layers described below show data and hazard probabilities related to these processes.
Earthquake Data Limitations:
It is important to note that these data do not take into consideration structure type or construction materials to assess the ability of a building to withstand the earthquake hazard. All structures should have a site-specific study performed to assess its vulnerability more accurately to the hazard.
Soil Amplification:
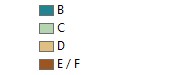
Soft or loose soil and near-surface geologic deposits can greatly amplify the shaking in an earthquake. Research sponsored by U.S. Geological Survey (USGS) and Federal Emergency Management Agency (FEMA) has defined a series of site classes that can be used to calculate the amount of amplification that will occur. These are called NEHRP (National Earthquake Hazard Reduction Program) site classes and range from A (very hard rock, no amplification) to E (soft soil, strong amplification) and F (very soft soil with special characteristics that require detailed investigation). The site classes are formally defined based on the velocity of shear waves (one form of earthquake shaking) in the upper 30 m (100 ft) below the earth’s surface. Where shear wave velocity data are not available, the soil amplification map is made by assigning NEHRP class values to the best available mapping of surface layers.
Data credit: OSHD, release 1.0, Oregon Department of Geology and Mineral Industries (DOGAMI)
NEHRP Site Classes
Perceived Shaking and Damage Potential:
The USGS produces standardized seismic hazard maps for the nation through its National Seismic Hazard Mapping (NSHM) project. These consider all possible earthquake sources and show the strength of shaking expected at several different probability levels including 10% chance in 50 years, 5% chance in 50 years, and 2% chance in 50 years. These maps show highly technical shaking parameters that are not readily understood by a non-technical audience and that do not relate simply to general earthquake damage. The maps also do not include the amplification effects of near-surface soft soils (as described above).
DOGAMI created this derivative product that adjusts the USGS 2% in 50-year probabilistic map using the NEHRP site classes from the statewide soil amplification map. The shaking values are based on the Modified Mercalli scale, which describes how earthquakes affect people, objects, and buildings in a general way. The 2% in 50-year perceived shaking and damage potential map shows the level of shaking that is expected to be exceeded only once every 2,475 years, based on our current understanding. In other words, there is an estimated 98% chance that only lesser levels of shaking will be experienced in the next 50 years. The map shows the Modified Mercalli Intensity in discrete classes, but expected levels of shaking vary in a more gradational way across the state.
Data credit: OSHD, release 1.0, Oregon Department of Geology and Mineral Industries (DOGAMI)
2% in 50-year Modified Mercalli Intensity
Probability of Damaging Shaking:
While the Perceived Shaking and Damage Potential map shows the highest shaking level expected at a fixed probability (once in 2,475 years), the Probability of Damaging Shaking uses the same data to show the likelihood of experiencing shaking as high as Mercalli Intensity VII in a 50-year time period. Mercalli Intensity VII is the level at which weak buildings begin experiencing considerable damage, and well-built ordinary structures have slight to moderate damage. It is meant to answer the question, “how likely am I to experience a damaging earthquake at my home, school, or workplace in the next 50 years?”
Data credit: OSHD, release 1.0, Oregon Department of Geology and Mineral Industries (DOGAMI)
Probability of Damaging Shaking (next 50 years)
Perceived Shaking and Damage Potential, Cascadia Subduction Zone Mw9:
These data show the average (median) level of shaking estimated from an ensemble of 30 models of magnitude 9 earthquakes rupturing the full Cascadia Subduction Zone (Wirth et al., 2021), updated with more the more detailed Oregon soil amplification map. The shaking levels are shown as Modified Mercalli Intensity classes; stronger shaking will produce greater structural damage.
Tsunamis, or earthquake-generated ocean waves, are another major hazard associated with Cascadia subduction zone earthquakes. For more information see the Tsunami Hazard section of HazVu or the DOGAMI
Tsunami Clearinghouse.
Data credit: OSHD, release 1.0, Oregon Department of Geology and Mineral Industries (DOGAMI)
Cascadia Mw 9 Modified Mercalli Intensity
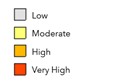
Liquefaction Susceptibility:
Layers of loose sand or silt that are saturated with water commonly liquefy when shaken strongly or repeatedly by an earthquake. The liquefied materials lose most of their ability to support overlying soil layers and structures, and buildings and bridges sink and tilt, while riverbanks may slump and flow into the river channel. In many large earthquakes, much of the severe damage that occurs is due to liquefaction. Although liquefaction is very damaging, it only affects specific geologic deposits. The liquefaction susceptibility layer shows where there are surface layers that might liquefy in a strong earthquake and how liquefaction-prone those layers are. The liquefaction susceptibility map is made by assigning susceptibility values – Very High, High, Moderate, Low, and Very Low – to the best available mapping of surface layers. Bedrock is not susceptible to liquefaction, so all areas that are mapped as bedrock in Oregon Geologic Data Compilation are not shown.
Data credit: OSHD, release 1.0, Oregon Department of Geology and Mineral Industries (DOGAMI)
Liquefaction susceptibility
Active Faults:
Faults are considered active either when many recorded earthquakes can be accurately located and shown to be along the fault, or where the fault has moved in geologically recent times and left a mark on the landscape or in young geologic deposits.
The USGS (through its NSHM project) has compiled databases of potentially active faults in cooperation with DOGAMI and other state geologic surveys. The USGS databases/maps are based on literature and include all faults for which there is some published evidence of movement (therefore earthquakes) in the past 1,600,000 years. Further information on the estimated recency of activity is available from the USGS webpage below.
Data credits: U.S. Geological Survey (USGS) and Oregon Department of Geology and Mineral Industries (DOGAMI), Quaternary fault and fold database for the United States, accessed January 27, 2023, at:
https://www.usgs.gov/natural-hazards/earthquake-hazards/faults.
Quaternary Active Faults

Earthquake Epicenters (1971-2008):
An earthquake epicenter is the point on the Earth?s surface that is directly above the location where an earthquake originates.
More information:
PNSN/Earthquake Map
Data credits: Pacific Northwest Seismic Network (PNSN) and Oregon Department of Geology and Mineral Industries (DOGAMI)
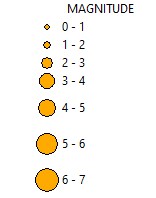
Earthquake Epicenters 1971 - 2022
Reference:
Wirth, E.A., Grant, A., Marafi, N.A., and Frankel, A.D., 2021, Ensemble ShakeMaps for magnitude 9 earthquakes on the Cascadia Subduction Zone: Seismol. Res. Lett., v. 92, no. 1, 99–211,
https://doi.org/10.1785/0220200240.
Tsunami Hazard
Between 2010 and 2013, the Oregon Department of Geology and Mineral Industries completed tsunami inundation modeling and mapping for the Oregon Coast. Much of the data was in a format that was difficult to work with and required significant processing to convert to a format that is useful for the public. The information presented in Hazvu addresses that deficiency, while also hosting new derivative products such as tsunami runup elevations and wave arrival times. These data are used to guide tsunami wayfinding signage along major highways (e.g. Highway 101) and in coastal communities to facilitate evacuation, the establishment of new critical facilities, for evacuation modeling, and for maritime preparation and guidance.
All the tsunami data layers included are associated with one of the following scenarios:
Far Field or Distant Tsunami