Tips and tools for using the map
Map Basics
Advanced Options
Map Basics
Get to Know the Map Interface
Look around the interface to familiarize yourself with all its features and tools. Hover your cursor over buttons and click them to see what you can do. Close windows by clicking on the "X" in the upper right of the window.
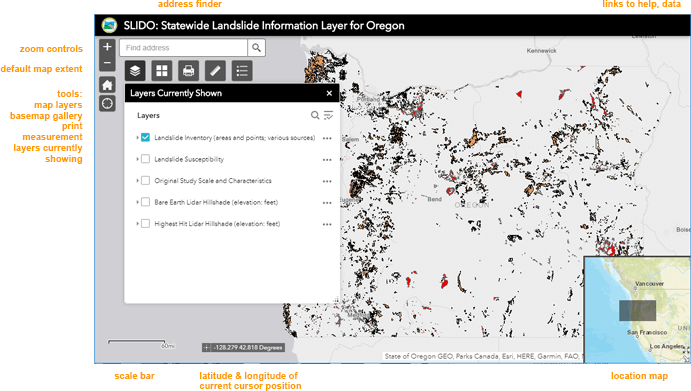
Zoom In and Out and Move Around the Map
Use the zoom controls to move to preset scales. You can also zoom in and out by using the roller wheel of your mouse. Pan around the map by clicking and holding down the mouse button while dragging the cursor around the map. Reset the map to the default opening scale and extent by clicking on the Home button.
Go to an Address
Type an address in the "Find address" field to zoom to that location. As you type, some suggested locations will appear. Be sure to choose the Oregon address!
Click on the Map to Get Pop-up Information
When you click anywhere on the map, a Pop-up window appears. Contents of these Pop-up windows are described in the sections below.

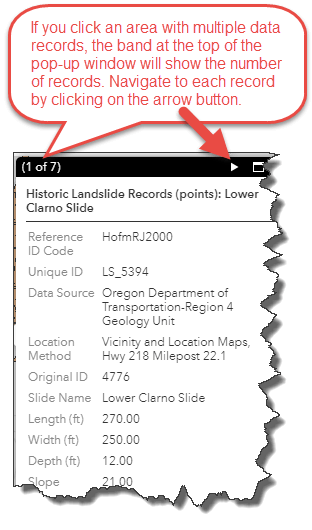
Depending on how many layers are visible and how far out you are zoomed, you may click an area with multiple data records. The band at the top of the pop-up window will show the number of records. Navigate to each record by clicking on the arrow button.
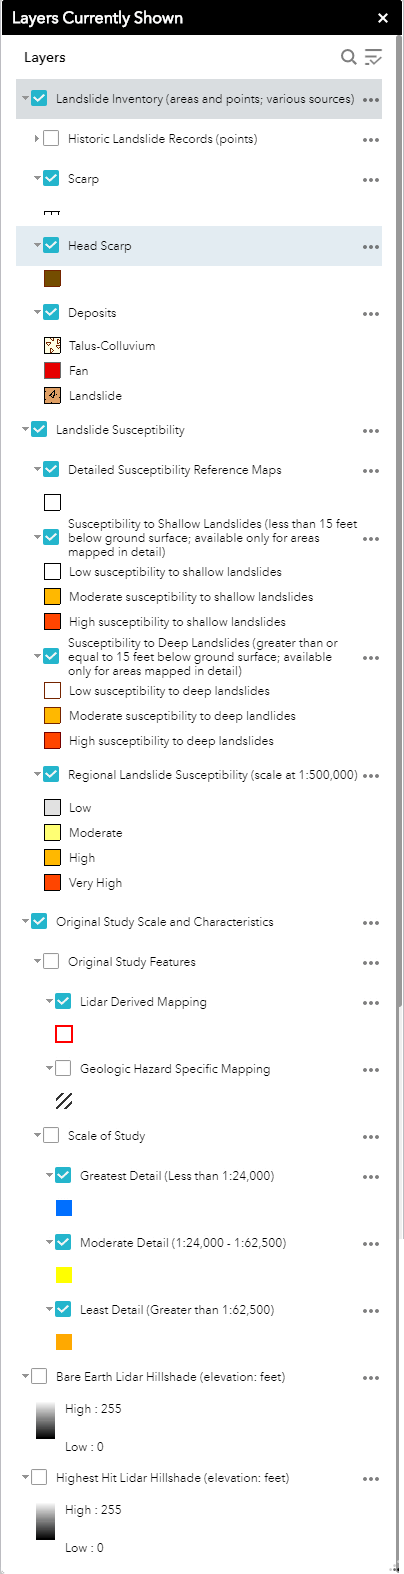
Show/Hide Map Layers
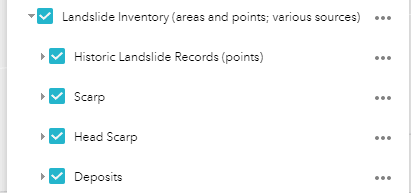
Toggle the checkbox next to a layer to turn it on and off. The higher-level layer must be toggled on for a sublayer to display, even if you have checked a sublayer's checkbox. Click on the down-pointing arrow to the left of a layer to see what's in that layer. Click on the "..." link to the right of a layer to see the transparency option for that layer. Only some layers have transparency.
Layer options:
For more control over how the map appears, you can set the transparency of layers.

Available map layers:
Landslide Inventory (areas and points, various sources)
This group of layers shows information for known landslides, whether point locations and mapped areas. Areas can be defined by scarps, head scarps and deposits.
- Historic Landslide Records (Points, various sources)

This layer shows center points of published or known historic (roughly 1849-2019) landslides and any available information about these landslides including damage and losses. If you click on a landslide point, information about that landslide is shown.
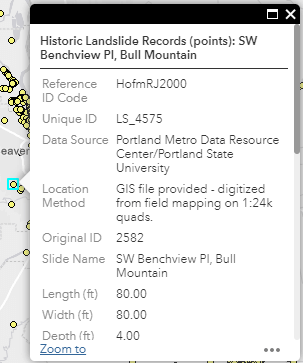
Click on a landslide point to see information for that point. The selected point is highlighted on the map. Use the scroll bar on the pop-up to see all the fields, if necessary. Click on the Zoom To button to recenter the map on the point.
| Information for Historically Active Landslides layer point features. |
|---|
| Reference ID Code | Reference ID Code: The reference identification code is the shortened code of the full reference to the original study map. The reference identification code is a text field that identifies the reference author by the first four letters of the last name, followed by the first and middle initials, followed by the publication year of work or the unpublished status, followed by the plate information (if any). Full references are provided on the Background page in the Source Data section. |
| Unique ID | Unique code assigned by data steward to each data point in database. |
| Data Source | The organization (company/agency) from which the entry information was obtained. |
| Location Method | Indication of how the location data were incorporated into the consolidated database and original methods of mapping (e.g., from aerial photographs, field investigations, etc.). |
| Original ID | Unique identifier used in original study. |
| Slide Name | Name associated with the slide or activity. |
| Length (ft) | Estimated length of the slide in feet. |
| Width (ft) | Estimated width of the slide in feet. |
| Depth (ft) | Estimated depth of the slide in feet. |
| Slope, in Degrees | Adjacent slope angle. |
| Type of Movement | Predominate type of movement exhibited by the slide mass (fall/topple, flow, translational slide, rotational slide, spread, other), following the nomenclature of Cruden and Varnes [Cruden, D. M., and Varnes, D. J., 1996, Landslide types and processes, in Turner, A.K., and Schuster, R.L., eds., Landslides: Investigation and mitigation: Washington, D.C. National Academy Press, Transportation Research Board, National Research Council, Special Report 247, p. 36?75]. |
| Type of Material | Predominate type of landslide material (rock, earth, debris, fill, other), following the nomenclature of Cruden and Varnes (1996). [Cruden, D. M., and Varnes, D. J., 1996, Landslide types and processes, in Turner, A.K., and Schuster, R.L., eds., Landslides: Investigation and mitigation: Washington, D.C. National Academy Press, Transportation Research Board, National Research Council, Special Report 247, p. 36?75]. |
| Area (sq ft) | Estimated area of slide material in square feet. |
Volume
(cu ft) | Estimated volume of slide material in cubic feet. |
| Deep or Shallow | Deep or shallow seated landslide; 4.5 m (15 ft) is the boundary value. |
| Damages | Account of damage associated with the slope failure. |
| Losses | Estimated or actual losses associated with activity, provided by original mapper. |
| Comments | Any notes provided by original mapper. |
| Year | Year of landslide failure |
| Date Range | Date range of landslide failure |
| Month | Month of landslide failure |
| Day | Day of landslide failure |
| Annual Cost | Estimated or actual annual cost associated with activity, provided by original mapper. |
| Repair Cost | Estimated or actual repair cost associated with activity, provided by original mapper. |
| Reactivation | Date of reactivation of previous landslide failure |
For more information, read the
Background and
Disclaimer pages.
-
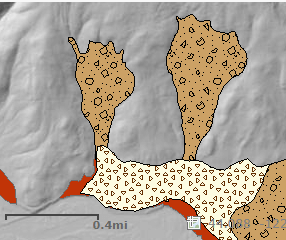
Landslide Inventory (Areas; various sources)
This layer shows mapped landslide areas. -
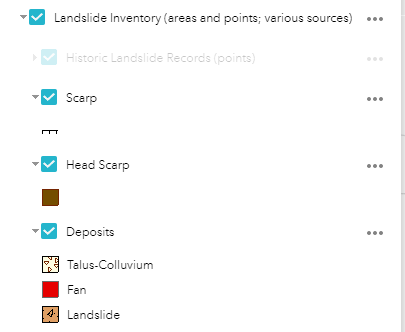
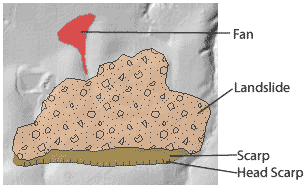
Scarp: concave, steep areas of a slope where material has been removed due to landsliding.
Head Scarp or Flank: area at the top or side of a slope where material has been removed due to landsliding.
Deposit:
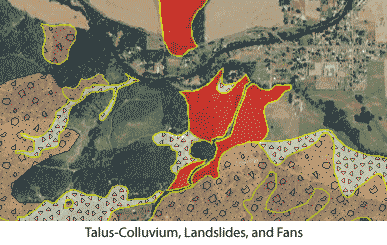
Talus-Colluvium: loose sediments built up at the base of a slope due to transportation by gravity.
Fan: an outspread mass of material, usually at the base of a narrow channel, deposited by a landslide.
Landslide: deposits of material that have been moved by landsliding.
Information shown for Landslide Inventory layer polygon features. The selected feature is highlighted on the map. If there are multiple features at that location, all features are listed; use the arrows at the top left of the pop-up box to see the data for each polygon. The current polygon is outlined in blue.
| Unique ID | This is the Reference ID Code plus a number that identifies a particular polygon from all the polygons identified in each study. This results in a unique ID for each polygon. |
| Type of Movement | A generalized field created to distinguish between three different types of landslide deposits: 1) landslide or landslide topography, 2) debris flow or other fan, and 3) talus or colluvium. |
| Movement Class | Predominate type of movement exhibited by the slide mass (fall/topple, flow, translational slide, rotational slide, spread, other), following the nomenclature of Cruden and Varnes [Cruden, D. M., and Varnes, D. J., 1996, Landslide types and processes, in Turner, A.K., and Schuster, R.L., eds., Landslides: Investigation and mitigation: Washington, D.C. National Academy Press, Transportation Research Board, National Research Council, Special Report 247, p. 36?75]. |
| Movement Code | | DS-R | Debris Slide - Rotational | | DS-T | Debris Slide - Translational | | ES-R | Earth Slide - Rotational | | ES-T | Earth Slide - Translational | | RS-R | Rock Slide - Rotational | | RS-T | Rock Slide - Translational | | DFL | Debris Flow | | EFL | Earth Flow | | RFL | Rock Flow | | DSP | Debris Spread | | RSP | Rock Spread | | RSP | Rock Spread | | DF | Debris Fall | | RF | Rock Fall | | RF | Rock Fall | | DT | Debris Topple | | ET | Earth Topple | | RT | Rock Topple | | C | Complex | | ES-R>EFL | Complex Earth Slide - Rotational & Earth Flow |
|
| Confidence | Confidence of identification: High (greater than or equal to 30); Moderate (11-29); Low (less than or equal to 20). |
| Age | Estimated age of slide activity: Historic (<150 years); Pre-Historic (>150 years). |
| Name | Name of slide or event. |
| Geology | Geologic unit from Special Paper 42. |
| Slope | Adjacent slope angle. |
| Head Scarp Height in feet | Change in elevation from bottom to top of head scarp. |
| Fan Height in feet | Change in elevation from top to toe of fan. |
| Failure Depth in Feet | Estimated and/or calculated slope-normal thickness of failure depth. |
| Deep or Shallow Seated | Deep or shallow seated landslide; 4.5 m (15 ft) is the boundary value. |
| Direction | Direction of movement, in increments of 22.5 degrees:
0, 22.5, 45, 76.5, 90, 112.5, 135, 157.5, 180 ,202.5, 225, 247.5, 270, 292.5, 315, 337.5, 360. |
| Volume in Feet | Estimated volume of slide material in cubic feet. |
| Reference ID Code | Reference ID Code: The reference identification code is the shortened code of the full reference to the original study map. The reference identification code is a text field that identifies the reference author by the first four letters of the last name, followed by the first and middle initials, followed by the publication year of work or the unpublished status, followed by the plate information (if any). Full references are provided on the Background page in the Source Data section. |
| Map Unit Label | The geologic map unit associated with the original mapping. |
| Description | Generalized landslide type: landslide, fan, or talus-colluvium. |
For more information, read the
Background and
Disclaimer pages.
-
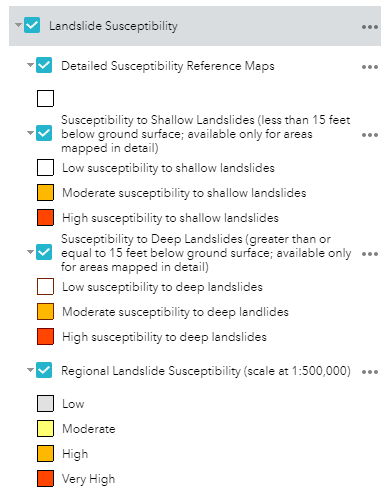
Landslide Susceptibility
This group of layers shows shows modeled data that predicts the potential of a region or area to have landslides. SLIDO 4.0 includes three kinds of landslide susceptibility data.
-
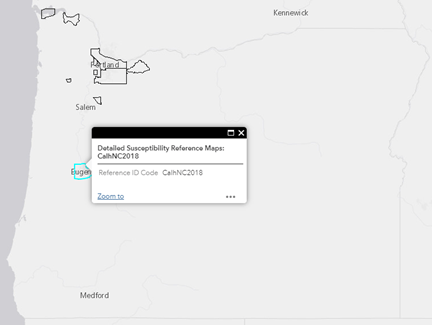
Detailed Susceptibility Reference maps
Some areas of the state have been mapped for landslide susceptibility at a detailed scale of 1:8,000 and are thus intended for
use at a local scale. If you click on a Reference map area, you can find the unique reference ID code for that map and look up the reference in the table
here

-
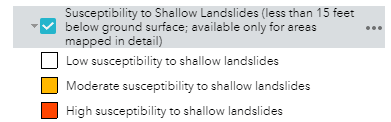
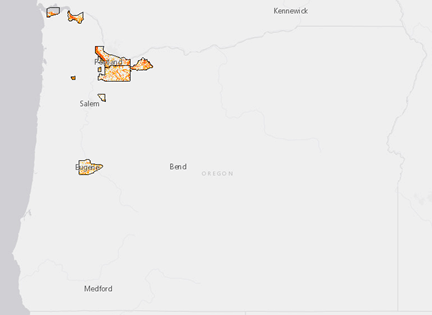
Susceptibility to Shallow Landslides
Some areas of the state have been mapped for landslide susceptibility at a detailed scale of 1:8,000 and are thus intended for
use at a local scale. The areas shown here are for shallow landslide susceptibility, that is, less than 15 feet below ground surface). Note that this detailed shallow susceptibility mapping is available only in some ares of the state. If you click on the map area, you can find the unique reference ID code for that map and look up the reference in the table
here.
-
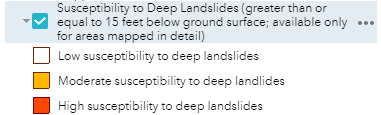
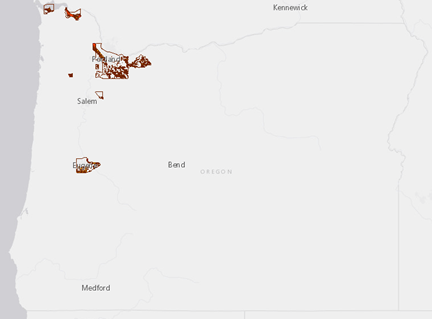
Susceptibility to Deep Landslides
Some areas of the state have been mapped for landslide susceptibility at a detailed scale of 1:8,000 and are thus intended for
use at a local scale. The areas shown here are for deep landslide susceptibility, that is, more than 15 feet below ground surface). Note that this detailed deep susceptibility mapping is available only in some ares of the state. If you click on the map area, you can find the unique reference ID code for that map and look up the reference in the table
here.
-
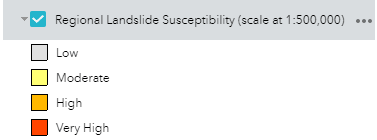
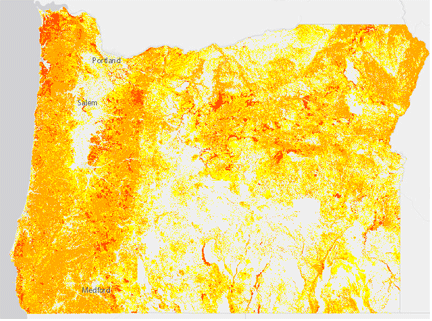
Regional Landslide Susceptibility (scale at 1:500,000)
This layer shows statewide landslide hazard information for regional planning and can be used to identify areas where more detailed landslide mapping is needed. For more information see DOGAMI
Open-File Report O-16-02
-
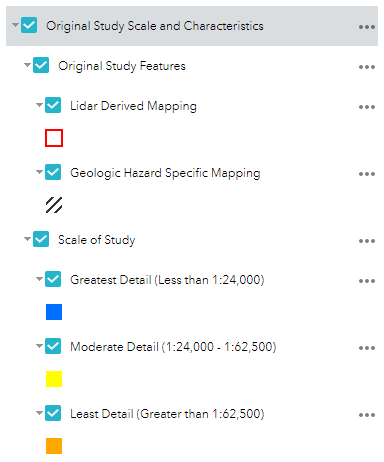
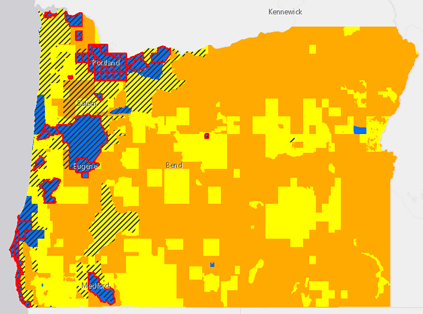
Original Study Scale and Characteristics
This layer shows the scale of the original mapping; if the map base is lidar-derived imagery (scale 1:8,000); and if the intent of the original mapping was for geologic hazard specific study. Scale and study intent can affect how carefully landslides in the original study were mapped.
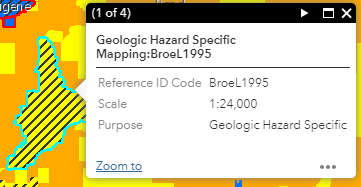
To see which source maps are being used at a point, make sure the Source Map Details layer is on and then click a point on the map. A pop-up showing the underlying source map(s) displays. The Reference ID Code corresponds to the source publication listed on the
Background page.
-
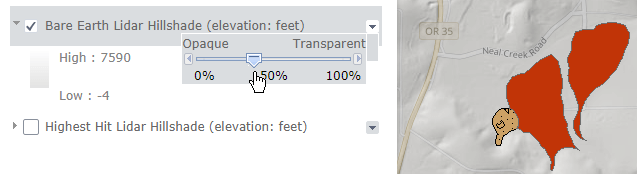
Bare Earth Lidar Hillshade
This layer shows last-return, or bare earth, lidar data to simulate the effect of topography without tree cover. Landslide morphology is commonly apparent in bare earth lidar imagery, and lidar-based mapping allows for much more accurate definition of landslide features.
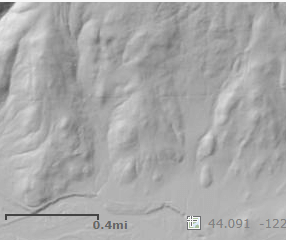
North of Thurston, Oregon.
Learn more about DOGAMI lidar
here
-
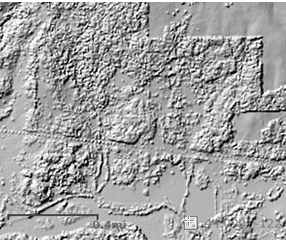
Highest Hit Lidar Hillshade
This layer shows first-return, or highest-hit, lidar data to simulate the effect oftopography with tree cover. The lidar image below shows the same area as the bare earth image above.
Change the Transparency of Layers
Change the transparency of some layers so you can more easily see the layers below that layer, for example to see basemap labels under lidar imagery. To change transparency of a layer, click on the down-pointing arrow to the right of a layer name. If the options include Transparency, click on the word to open the transparency slider, then move the slider until you at the transparency you desire.
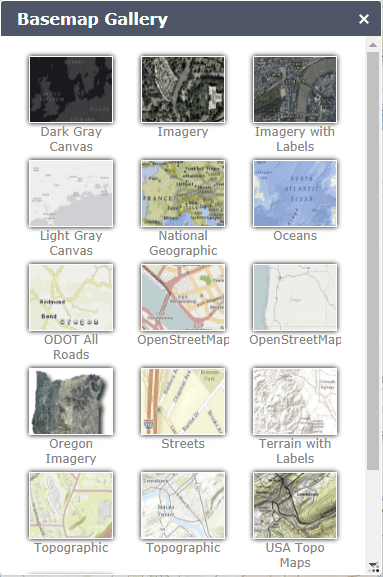
Change the Basemap
You can choose from a variety of basemaps to suit your needs. Click on the Basemap gallery button to select the one you want.
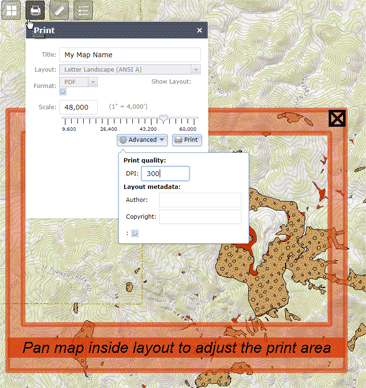
Print a Map
You can print a map to your local printer or to a PDF. Click on the Print tool button, then follow the directions given in the window. You can adjust the print window area, page layout, page size, scale, and resolution (dots per inch, or dpi), and add your name to the map. The resulting map will not include a legend. You can print the full map legend from this
PDF
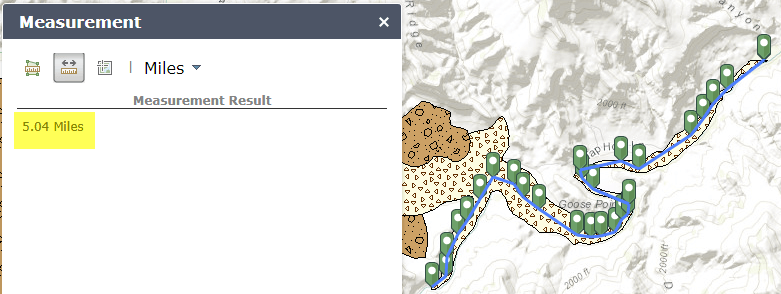
Measure Distances and Areas
You can measure areas and distances on the map, or get the latitude and longitude of a point. Click on the Measurement tool button, then follow the directions given in the Elevation Profile window. Clear the results to start again.
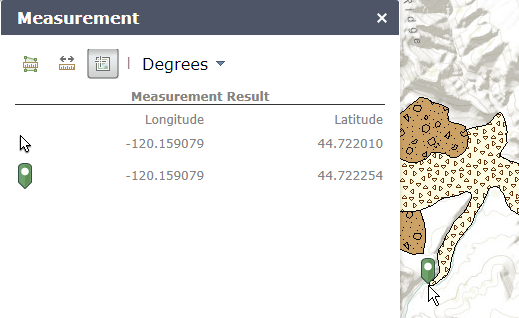
Get the Latitude and Longitude of a Location
Click on the Measurement tool button, then the Location button. On the map, click where you want to see the coordinates. The green marker shows the coordinates where you clicked, while cursor shows your present cursor location.
Advanced Options
Get the SLIDO Data Used to Make the Online Map
If the map does not provide you enough options, you can
download the entire SLIDO geodatabase. The geodatabase is an Esri-formatted geodatabase and requires specialty software to open and use.