Keeping roads safe during winter
Keeping roads safe during winter involves plowing snow, placing sand for increased traction, applying deicing products, and managing winter highway closures. This work is done by our frontline service staff and contractors who operate a fleet of specialized equipment, as well as staff who patrol roads, operate chain-up areas, load materials, clear fallen trees, and fix broken vehicles. Delivering consistent service from year to year helps our communities prepare for winter conditions they may encounter when they travel.
Every winter season is different. We shift our crew’s workloads to match the changing weather. Mild winters mean our sand, deicer and other materials last longer and our crews can spend less time plowing snow and more time on other routine road maintenance.
In recent years, we’ve experienced harsher winters with more storms throughout the state. In January 2024 a week-long storm swept through most of Oregon. Our crews put in over 20,000 hours of around the clock work to keep up with the weather. We used 6.5 million pounds of salt and plowed nearly 78,000 miles of road in the central and southern Willamette Valley alone.
We are improving maintenance data collection
While maintenance data is currently collected through mostly manual processes, progress is being made toward increased automation and system integration. In 2021, we contracted with GoFleet Corporation to provide an Automated Vehicle Location (AVL)/Telematics solution, allowing us to automatically track truck activities, such as where we are snow plowing and where we apply winter maintenance materials.
AVL and Telematic equipment installations to date:
- Heavy Fleet
- AVL only: 197
- Full Telematics: 330
- Light & Medium: 1447
- Sweepers/Vactors: 15
- Total: 1989
Weather extremes caused by climate change have resulted in more frequent and severe emergency events
- On average, we spend an additional $18 million every 5 years on wildfires, flooding, and other extreme weather events. These large expenses come with transportation impacts like closures and delays. For example:
- Between 2020 and 2023, 56 wildfire events and 212 rockfalls caused over 4,300 hours of travel delays.
- With existing resources we will be challenged to keep up with more frequent and severe weather events, which will contribute to an increase in travel delays.
- Since 2020, we’ve had 46 emergency events. Each event cost an estimated $8.2 million.
- Few of our emergency events qualify for federal reimbursement, meaning the cost burden is placed on the state.
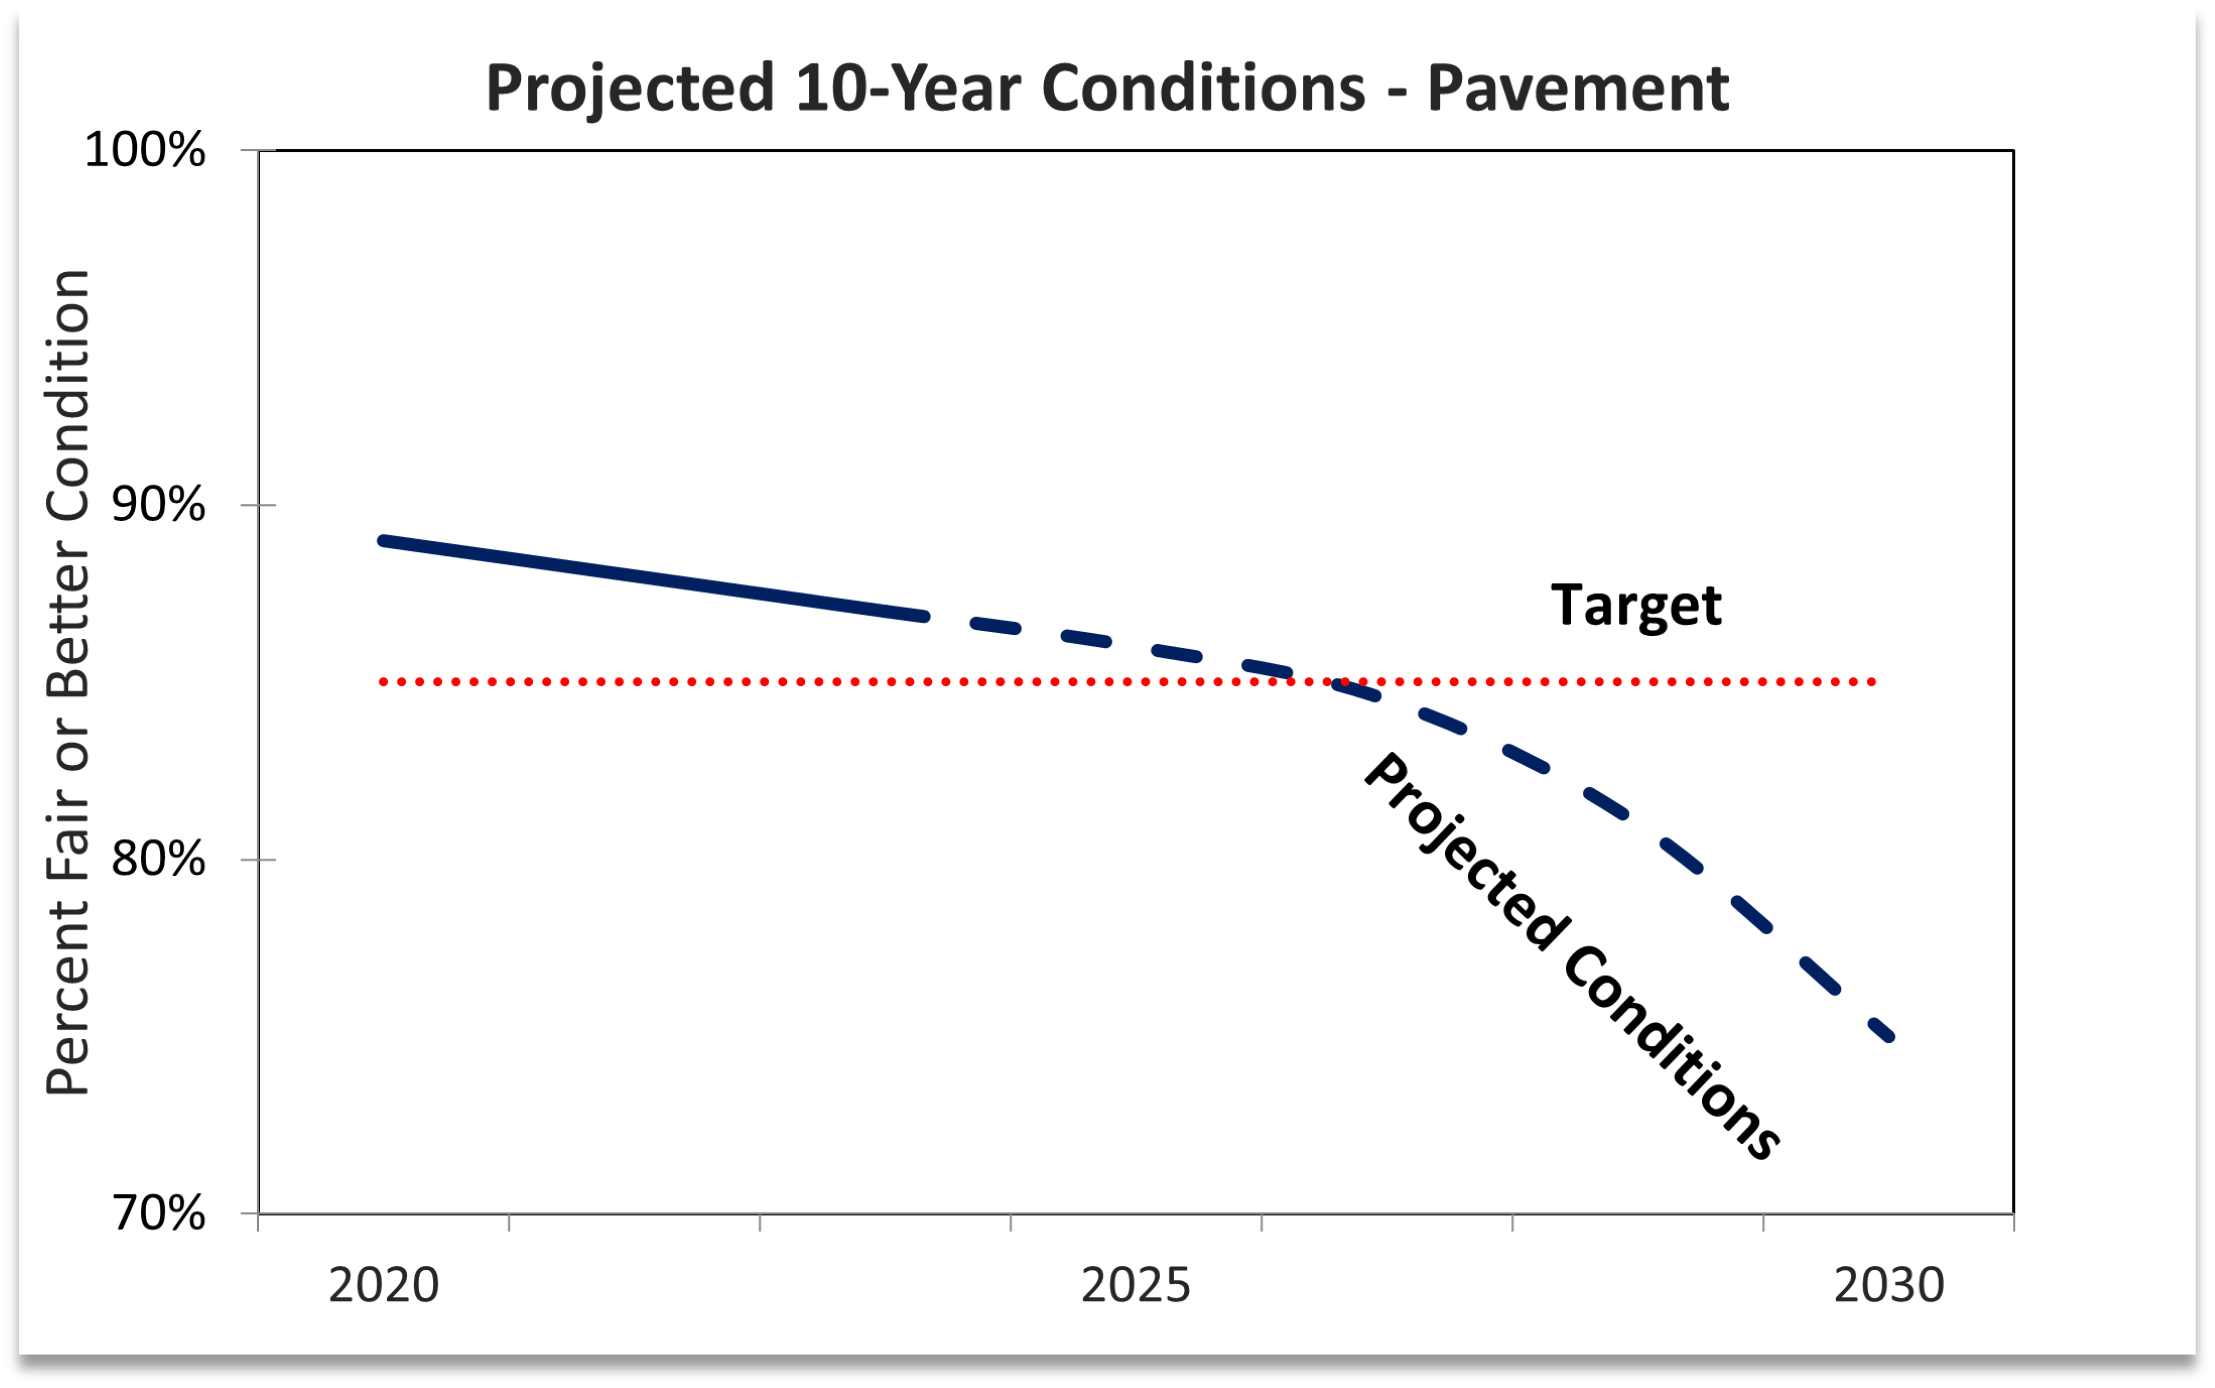
The condition of ODOT roads and systems are declining
At current funding levels, state highway pavement, bridges, culverts, road signs and traffic signals are deteriorating at a faster rate than we can repair and replace them. With current federal funds, we can only afford to pave interstates after 2027.
- Most of the culverts we manage are near or past their 50-year design life.
- Culverts are key to keeping water from damaging our roads; they are especially important as climate change makes storms more intense in the coming decades.
- Declining pavement conditions means more potholes and ruts on our roads. Potholes and ruts can damage vehicles and make travel less safe for all road users.
 Updated:02/2025
- We manage over 18,000 miles of pavement, 87% of those miles are currently rated as 'fair' or better condition.
- Pavement conditions began to decline in 2018.
- By 2030, the mileage of poor road will be twice what it was 5 years ago; doubling the burden on maintenance crews to keep them safe for travel.
 Updated:02/2025
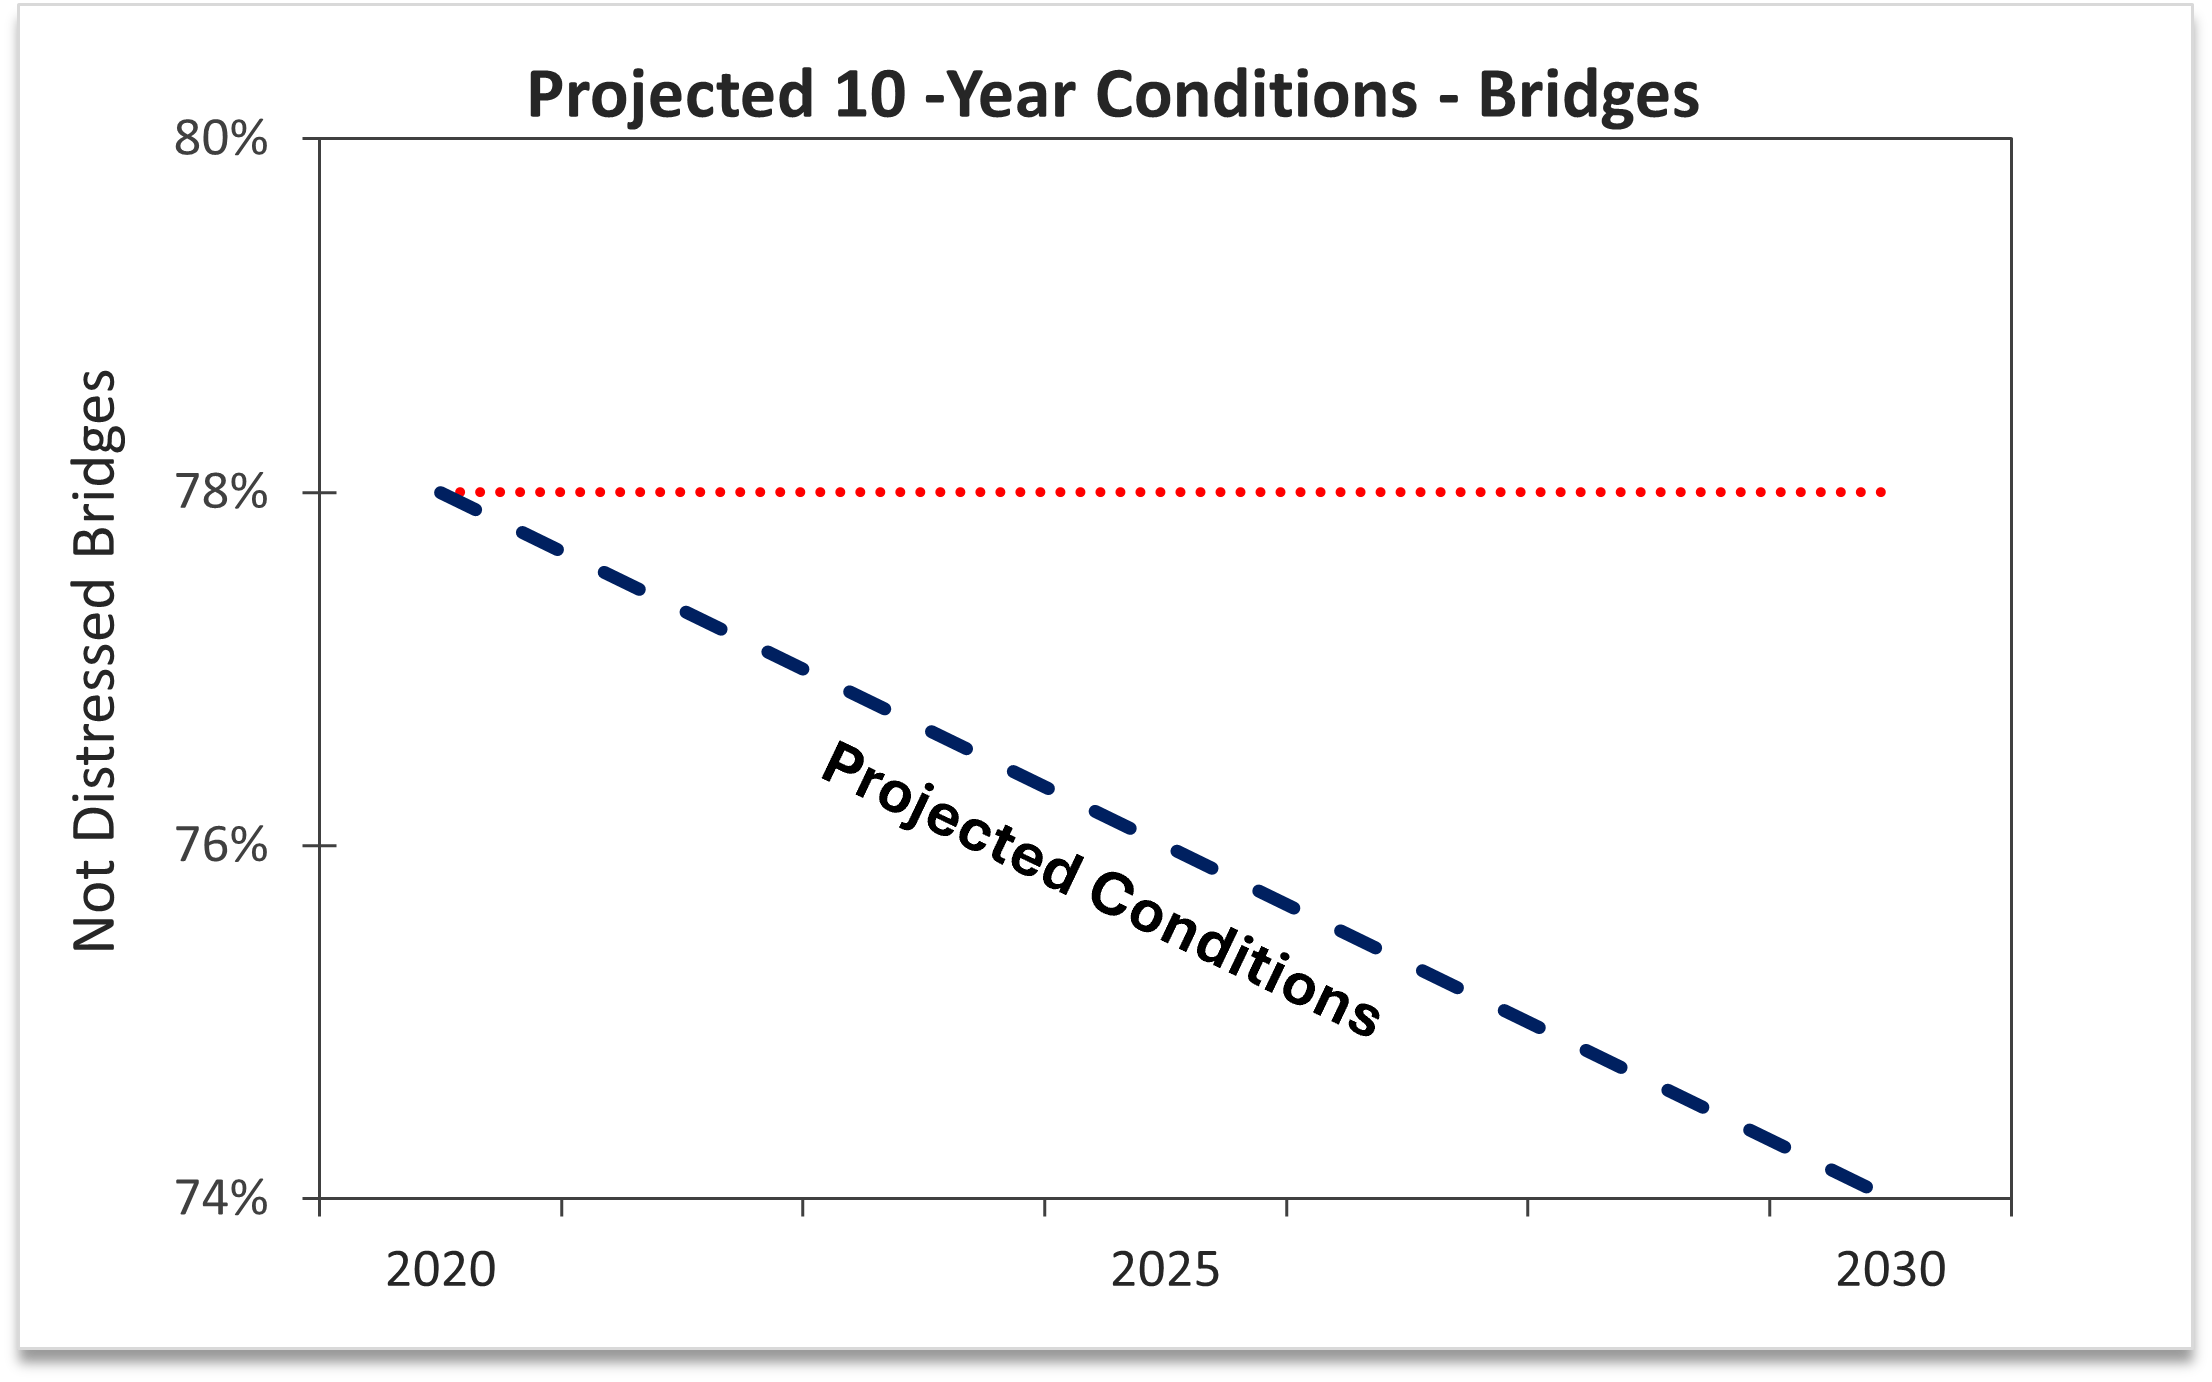
- We don't have enough funding to keep up with maintenance on all our bridges, so to balance that shortfall with public safety, we restrict heavy vehicles like semi-trucks from using the bridges in worst shape.
- 435 of our 2,786 bridges have at least one weight restriction.
- Weight restrictions negatively impact local communities and businesses. Heavy trucks carrying goods must take long, costly detours, and heavy emergency vehicles can't get where they need to go as efficiently.
Lanes are opened quickly after a crash or other incident
- Travelers experience 4 minutes of delay for every 1 minute a lane on a highway or interstate is blocked.
- Most crashes that block a lane are cleared within 90 minutes.
- On average, it takes one hour to get traffic moving by opening at least one lane, establishing a detour route, or providing another solution that reduced delay caused by incidents.
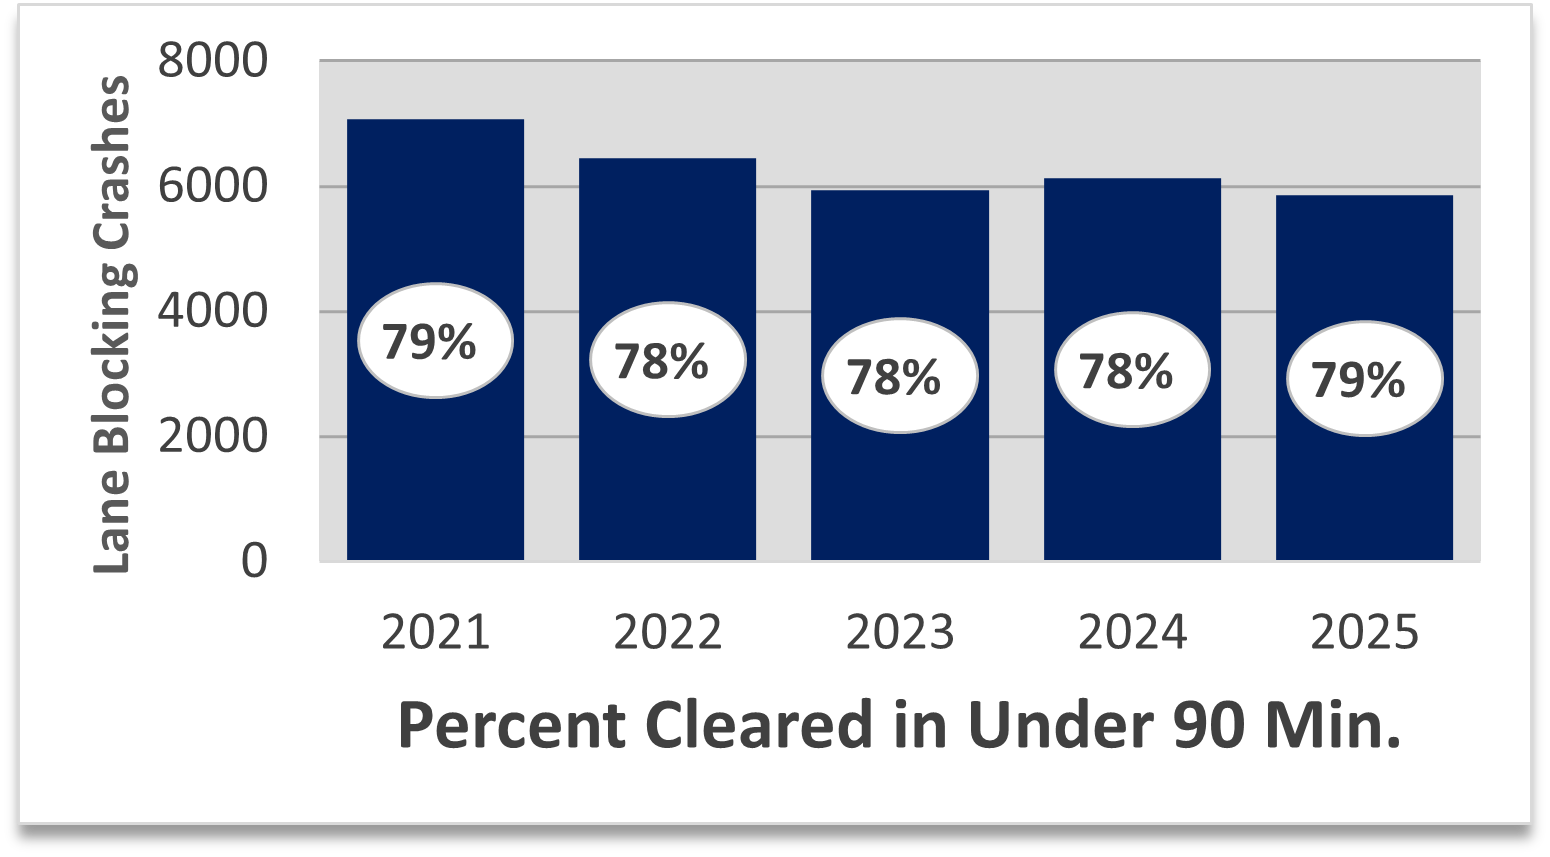
Source: ODOT Transportation Systems Operations
Litter and graffiti issues are increasing at rates greater than we can keep up with
Litter and graffiti happen in all parts of the state and ODOT, working with local governments, addresses those issues to the best of our ability.
- In 2023, Senate bill 5701 gave ODOT $20 million in general fund dollars for litter removal, graffiti cleanup, camp cleanup and access prevention in the Portland metro area for use through June 2025.
Outcomes as of June 30 2025:

 ODOT spent $22 million to clean and restore highway property during the 2021-23 budget cycle.
To learn more about litter and graffiti clean-up efforts, please visit:

Visit our Maintenance and Operations website to learn more
To submit a question or comment: