Tips & tools for using the map
Map Basics
Map Tools
Advanced Map Options
Map Basics
Get to Know the Map Interface
Look around the interface to familiarize yourself with all its features and tools. Hover your cursor over buttons and click them to see what you can do. Close windows by clicking on the "X" in the upper right of the window.
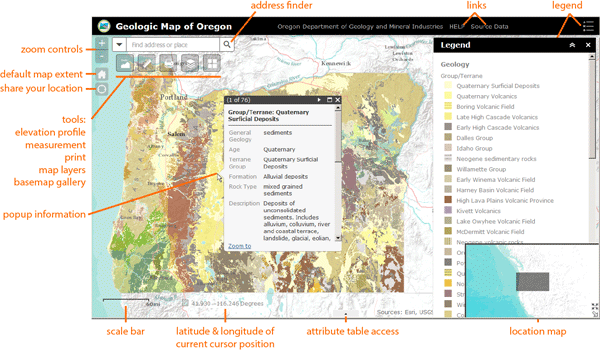
See a larger version of this image.
Zoom In and Out and Move Around the Map
Use the zoom controls to move to preset scales. You can also zoom in and out by using the roller wheel of your mouse. Pan around the map by clicking and holding down the mouse button while dragging the cursor around the map. Reset the map to the default opening scale and extent by clicking on the Home button.
Go to an Address
Type an address in the "Find address or place" field to zoom to that location. As you type some suggested locations will appear. Be sure to choose the Oregon address!
Click on the Map to Get Pop-up Information
When you click anywhere on the map, a Pop-up window appears. Contents of these Pop-up windows are described in the sections below.
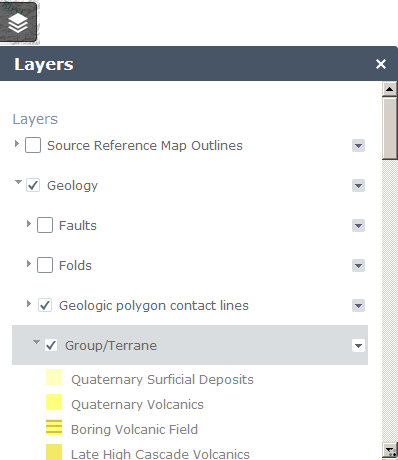
Show/Hide Map Layers
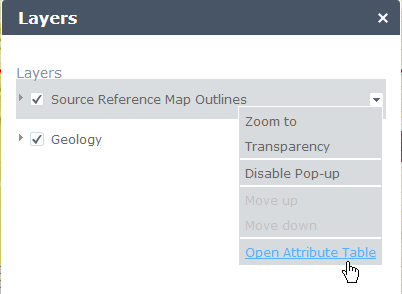
Toggle the checkbox next to a layer to turn it on and off. The higher-level layer must be toggled on for a sublayer to display, even if you have checked a sublayer's checkbox. Click on the down-pointing arrow to the left of a layer to see what's in that layer. Click on on the down arrow to the right of a layer to see options for that layer.
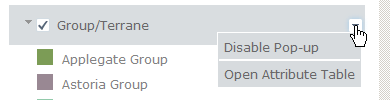
Layer options:
Available map layers:
- Source Reference Map Outlines
This layer shows the extents of the original source maps used to create the Oregon Geologic Data Compilation, release 6 (OGDC-6). In areas where overlapping maps existed, DOGAMI geologists chose the best available map at the time. These choices sometimes led to artificial "boundary faults" where geologic map units are abruptly cut off.
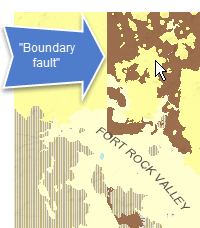
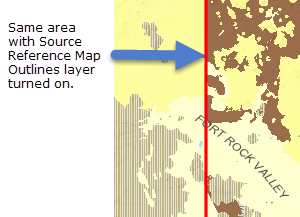
To discover the source map used for an area, click on the area. The Pop-up window provides the source reference and, where available, a link to the original source map.
-
Geology
-
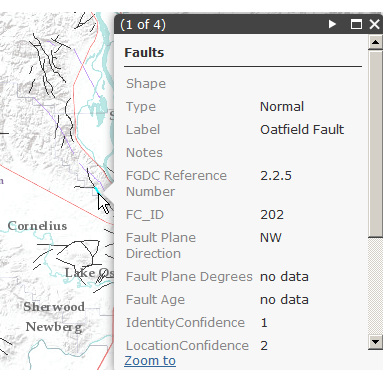
Faults - turn on this layer to see the mapped faults in the state that are part of OGDC-6. Faults are places where pieces of the earth's crust move relative to each other. Click on the a fault to learn more about it. It may be easier to find the faults on the map if you
change the basemap
-
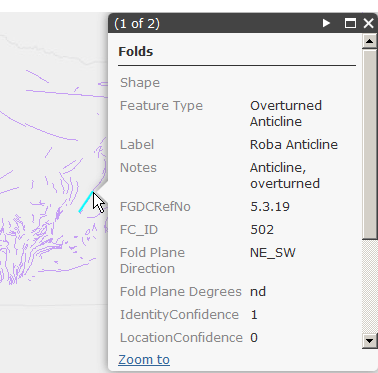
Folds - turn on this layer to see the mapped folds in the state that are part of OGDC-6. Folds are places where stacks of rocks have been curved or bent after the rocks were originally emplaced. Click on the a fold to learn more about it. It may be easier to find the folds on the map if you
change the basemap
-
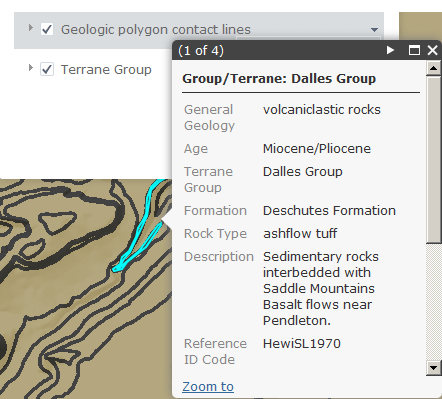
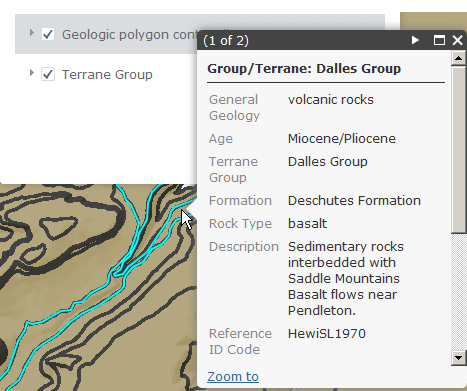
Geologic polygon contact lines - this layer is visible at the three most zoomed in levels only. If you have the layer checked on but don't see the lines, try zooming in more. This layer shows the outlines of the actual geologic polygons in the source maps that DOGAMI geologists digitized for OGDC and that were subsequently grouped to create the larger "Group/Terrane" polygons.
For example, in the two figures below, the larger Group/Terrane (brown color) is The Dalles Group. However, when the geologic polygons layer is turned on and you click on different polygons in the same Group/Terrane, you can see that the original mapper, S.L. Hewitt, 1970, mapped some of the rock as ashflow tuff and some of the rock as basalt. He assigned both rock types to the Deschutes Formation. The numbers at the top of the window show how many polygons exist. Clicking on the right-pointing arrow allows you to cycle through and highlight each the polygons assigned to that type.
-
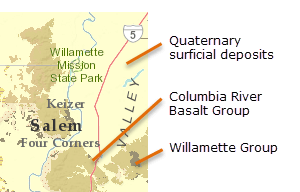
Group/Terrane - This layer contains related rocks grouped into larger "units" that can be more easily displayed on the map for a "big picture" view of the state's geology. The Legend shows the Group/Terrane compilation units. For example, in the image below, you can see that the area around Salem is mostly composed of Quaternary surficial deposits, with some Columbia River Basalt Group rocks and some Willamette Group rocks. Each of these Group/Terranes is in turn composed of a number of formations and related rock types. You can see what these are in this area by cycling through the Pop-up window features when you click on a particular Group/Terrane.
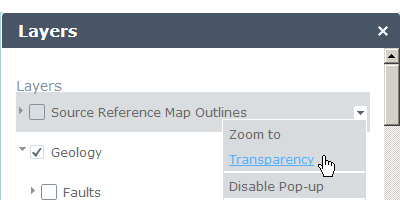
Change the Transparency of Layers
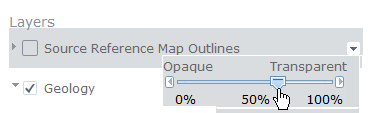
Change the transparency of some layers so you can more easily see the layers below that layer. To change transparency of a layer click on the right-pointing arrow to the right of a layer name. If the options include Transparency, click on the word to open the transparency slider, then move the slider until you at at the transparency you desire.
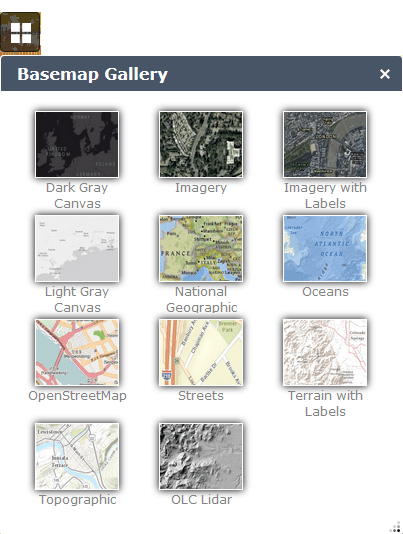
Change the Basemap
You can choose from a variety of basemaps to suit your needs. Click on the Basemap gallery button to select the one you want.
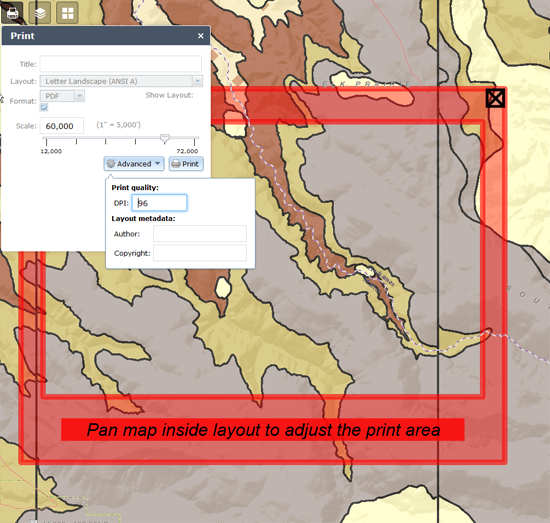
Print a Map
You can print a map to your local printer or to a PDF. Click on the Print tool button, then Click on the Elevation Profile tool then follow the directions given in the window. You can adjust the print window area, page layout, page size, scale, and resolution (dots per inch, or dpi), and add your name to the map. The resulting map will not include a legend. You can print the full map legend from this
PDF
Map Tools
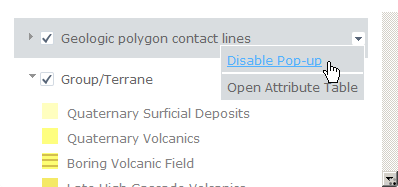
Disable Pop-ups
If you want to concentrate on the Pop-up results of one layer, you can disable the Pop-ups in other layers.
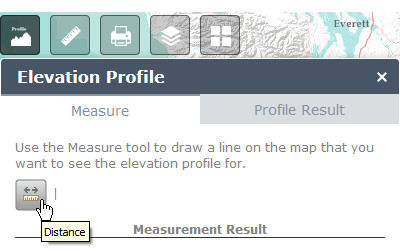
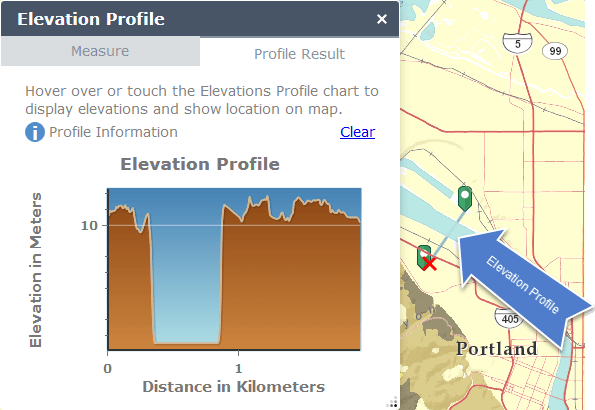
Make an Elevation Profile
You can make an elevation profile by drawing a line from one place to another. Click on the Elevation Profile tool button, then follow the directions given in the Elevation Profile window. Clear the results to start again. Note that the vertical exaggeration can be quite large.
Result:
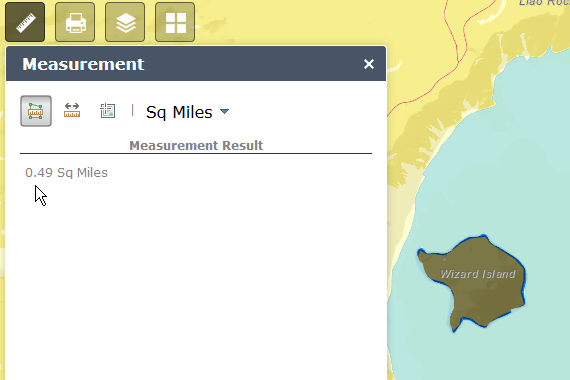
Measure Distances and Areas
You can measure areas and distances on the map, or get the latitude and longitude of a point. Click on the Measurement tool button, then follow the directions given in the Elevation Profile window. Clear the results to start again.
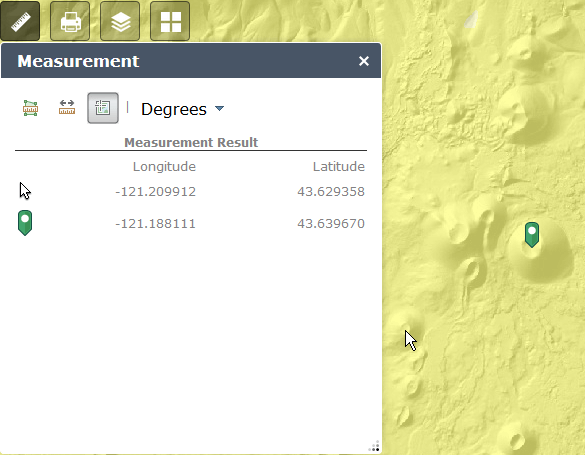
Get the Latitude and Longitude of a Location
Click on the Measurement tool button, then the Location button. On the map, click where you want to see the coordinates. The green marker shows the coordinates where you clicked, while cursor shows your present cursor location.
Advanced Map Options
View and Use the Attribute Table to Filter Data
To dig into the underlying data on the map, open the attribute table. You can access the table from the up-pointing arrow at the bottom center of the map window, or from the down-pointing arrow to the right of the layers in the map Layers window. Resize the attribute table window by hovering the cursor at the top of the attribute table window until the cursor turns into a double-pointing arrow, then drag the window to resize it.
The Attribute window show tabs for each visible map layer. The number of features in the layer is shown at the bottom left of the window.
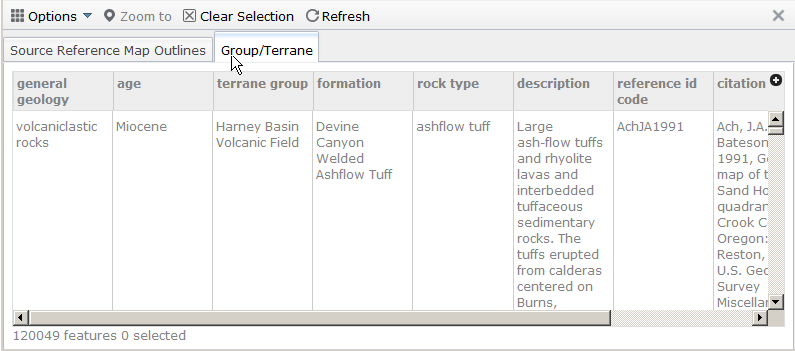
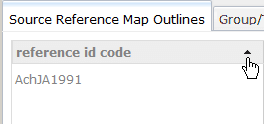
You can sort the fields by clicking the the small arrow on the right hand side of the field column. If no arrow shows, click on the column heading to select the column first.
You can filter, filter by map extent, and show/hide columns by clicking on the Options button. Show just the features in the current map window by clicking the Filter by Map Extent option. You can clear a selection or refresh the table. To zoom to a feature on the map, click the row to select the feature, then click on the Zoom to button. To select multiple rows, Shift-click the rows.
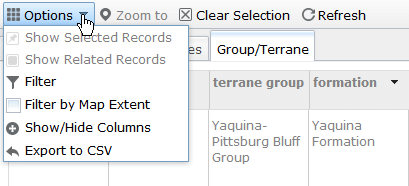
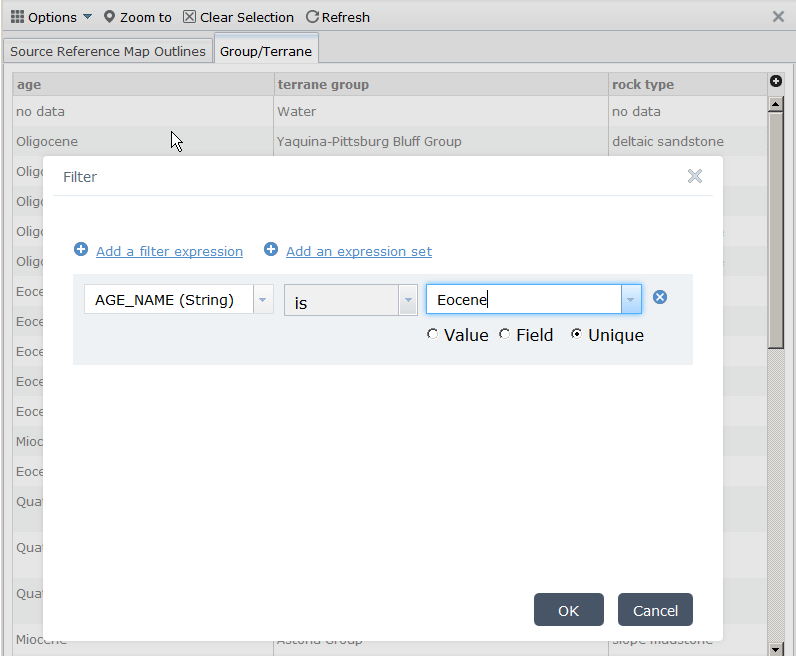
Click on Filter to set up queries to find specific data.
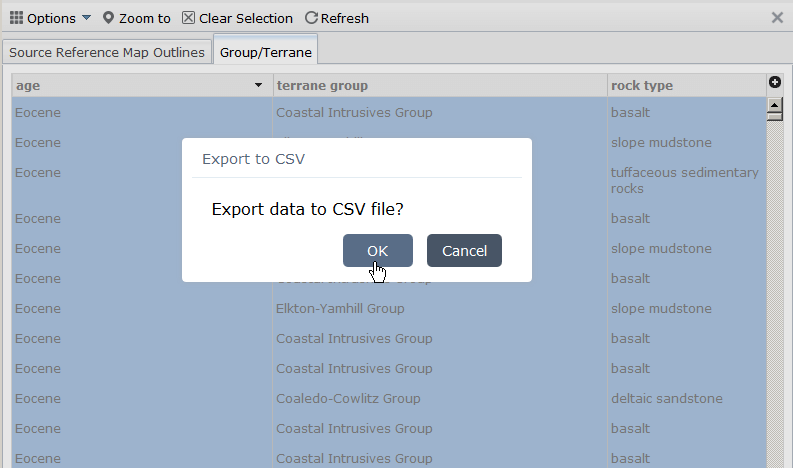
Export Attribute Table Data
You can export data, including filtered data to a CVS (comma separated values) file or or Excel file. Be sure you have selected all the rows you want to export before selecting the Export option or you will get only the table headings. Although the button gives you only the CVS file export option, after you click OK, you can select to open the data in Excel or save it as CVS format.
Get the OGDC Data Used to Make the Online Map
If the Attribute table and map do not provide you enough options, you can download the entire OGDC-6 geodatabase. The geodatabase is an Esri-formatted geodatabase and requires specialty software to open and use.