Lidar technology provides very precise, accurate, and high-resolution images of the surface of the earth, vegetation, and the built environment. Lidar is an essential tool in helping Oregon better understand natural hazards and resources, and also manage and plan enhancements to water systems, roads, open space, and ecosystems.
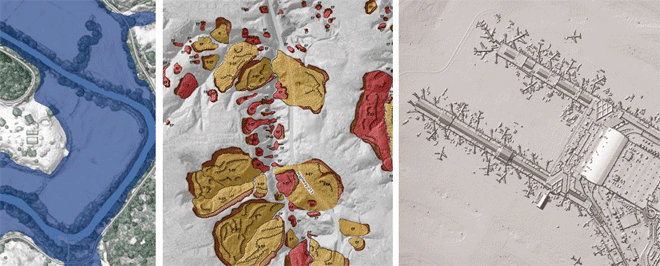
 Lidar in Action: Geologic Hazard and Resource Mapping. DOGAMI uses lidar data in new-generation geologic hazard and resource mapping for an accurate, complete understanding of floods, landslides, tsunami, coastal erosion, geology, and water resource potential. For example, more landslides have been identified and mapped in the past five years with lidar than had been mapped in the previous 60 years. Land that has moved in the past is more likely to slide in the future – so accurate understanding of where landslides have occurred saves lives and protects property.
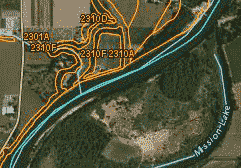
 Lidar in Action: Protecting and Planning for Roads. The Oregon Department of Transportation has identified multiple practical uses for using lidar to keep roads open and maintained, including managing landslide risks along the state highway system, prioritizing repair and preventive maintenance, and highway corridor planning and management.
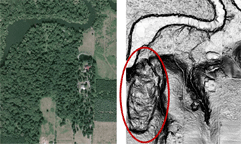
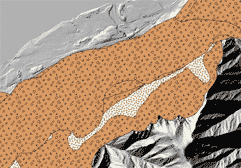
 Lidar in Action: Identifying Agricultural Resources. Natural Resources Conservation Service mapped soils in Willamette, Wallowa, Grande Ronde, Baker, Yamhill, and Deschutes Valleys to help understand where prime farmland soils are located, and to provide farmers with useful information for optimizing drainage and irrigation.
More Uses of Lidar Data
Lidar offers an accurate, efficient, and cost-effective way to:
- Find landslides, old cuts and grades
- Measure and estimate fills and cuts
- Find stream channels, measure gradients
- Measure the size and height of buildings, bridges
- Locate and measure every tree in the forest
- Characterize land cover
- Model floods, fire behavior
- Locate power lines and power poles
- Support archeological investigations
- Map wetlands and impervious surfaces
- Define watersheds and viewsheds
- Model insolation and shading
- Map road center and sidelines
- Find law enforcement targets
- Map landforms and soils
- Assess property remotely
- Inventory carbon
- Monitor quarries, find abandoned mines
- Enhance any project that requires a detailed and accurate 2-D or 3-D map
How to Use Lidar: Resources for Technical Users
(last updated 09/08/2022)