The Cascade Range is part of a chain of volcanoes that parallel the coast of northern California, Oregon, Washington, and southern British Columbia. These volcanoes exist because oceanic crust of the Juan De Fuca plate subducts below the continental crust of the North American plate, causing melting at depth. This magma feeds numerous volcanoes. Volcanic activity can produce hazardous events including fallout of tephra (volcanic ash), lahars (volcanic mudflows or debris flows), pyroclastic flows (avalanches of hot volcanic material), lava flows, and landslides.
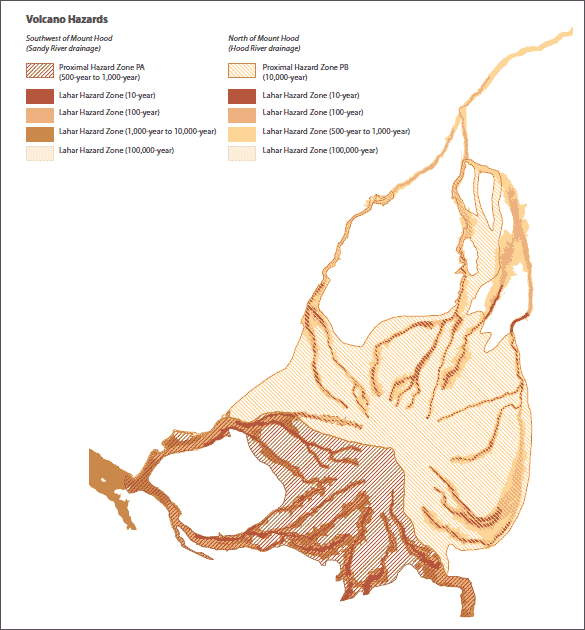
. Volcano hazard zones can be divided into proximal (near the volcano) and distal (far from the volcano) (Scott and others, 1997). Only proximal hazard zones and lahars are evaluated in this study. Proximal hazard zones are from Scott and others (1997). Proximal hazard zones extend from the summit out to around 15 miles (24 kilometers) and are areas subject to several types of hazards such as rapidly moving landslides, pyroclastic surges, and debris avalanches. The proximal zone labeled PA along the southwest side of the mountain (orange) has a return period of roughly 500 to 1,000 years; the proximal hazard zone labeled PB (yellow) has a return period of 10,000 years (Scott and others, 1997). See the accompanying report for more information.
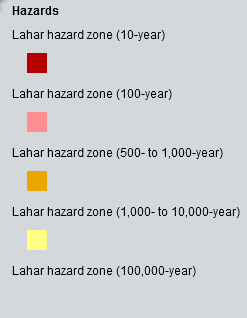 Lahar hazard zones. Lahars, or volcanic debris flows, are water-saturated mixtures of soil and rock fragments that can travel very long distances (over 62 miles [100 kilometers]) and as fast as 50 miles (80 kilometers) per hour in steep channels close to a volcano. Lahar hazard zones for five different return periods (10, 100, 500- 1,000, 1,000-10,000, and 100,000 years) were created by using the GIS-based program LAHARZ (Iverson and others, 1998). See the accompanying report for more information.
The
Map Viewer and Plate 2 [preview] contain volcano hazard data.
The image below highlights the difference in the proximal hazard zone the Sandy River and Hood River drainages. Proximal Zone PA (Sandy River drainage) has a return period of 500 to 1,000 years; Proximal Hazard Zone PB (Hood River drainage) has a return period of 10,000 years.
Volcano Hazards References:
- Iverson, R.M., Schilling, S.P., and Vallance, J.W., 1998, Objective delineation of lahar-inundation hazard zones: Geological Society of America Bulletin, v. 110, no. 8, p. 972-984.
- Scott, W.E., Pierson, T.C., Schilling, S.P., Costa, J.E., Gardner, C.A., Vallance, J.W., and Major, J.J., 1997, Volcano hazards in the Mount Hood region, Oregon: U.S. Geological Survey Open-File Report 97-89, 14 p.
Landslide Hazards [PDF of full viewer legend]
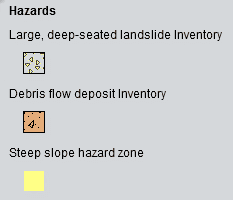
The term landslide encompasses a range of geologic events including rock falls, debris flows, earth slides, and other mass movements (Turner and Schuster, 1996; DOGAMI, 2008). Three types of landslide hazards are shown on this map: large, deep-seated landslides, debris flow deposits, and zones of steep slopes.
Deep-seated landslides have failure surfaces usually tens of feet below the surface and can cover large areas from acres to square miles. These types of landslides tend to move relatively slowly (less than an inch per year) but can lurch forward if shaken by an earthquake or if disturbed by removal of material from the toe, by addition of material to the head, or by addition of water into the slide mass. Deep-seated landslides are hazards because they can fail again.
Debris flows tend to initiate in the upper portion of a drainage, then pick up water, sediment, and speed as they travel down a drainage. When debris flows reach the mouth of the confined or steep portion of the drainage, they tend to spread out and deposit most of their material in a fan-shaped area. Other types of landslides that occur on slopes near a channel or accelerated erosion during heavy rainfall or snowmelt can initiate debris flows. Debris flow deposits are hazards because future debris flows are likely to cover some of the same areas as past events and loose material can move again if disturbed by earthquakes or heavy rains.
Steep slopes are areas that are more susceptible to landsliding.
Inventories of large, deep-seated landslides and debris flow deposits were created using the methodology developed by Burns and Madin (2009), data from the Statewide Landslide Information Database of Oregon (SLIDO) release 1 (Burns and others, 2008), and new lidar-based mapping. In total, 394 deep-seated landslides and 1,112 debris flow deposits were inventoried for this area. Steep slope zones were created by identifying slopes greater than 26 degrees (2:1 horizontal to vertical slope) on a slope map derived from a lidar-based 3-foot (0.9 meter) digital elevation model. See the accompanying report for more information.
The
Map Viewer and Plate 3 [preview] contain landslide hazard data.
Landslide Hazard References:
- Burns, W.J., and Madin, I.P., 2009, Protocol for inventory mapping of landslide deposits from light detection and ranging (lidar) imagery: Oregon Department of Geology and Mineral Industries Special Paper 42, 30 p.
- Burns, W.J., Madin, I.P., and Ma, L., 2008, Statewide landslide information database for Oregon, release 1 (SLIDO-1): Oregon Department of Geology and Mineral Industries, 26 p., scale 1:500,000, geodatabase.
- DOGAMI (Oregon Department of Geology and Mineral Industries), 2008,
Landslides hazards in Oregon: Oregon Department of Geology and Mineral Industries, fact sheet, 2 p. Web:
- Turner, A.K., and Schuster, R.L., eds., 1996, Landslides: Investigation and mitigation: National Research Council, Transportation Research Board, Special Report 247, 673 p.
Flood and Channel Migration Hazards [PDF of full viewer legend]
 Flooding. Most flooding in the study area occurs during large winter and spring storms when heavy, warm rain falls on accumulations of low-elevation snow (USDA SCS, 1977). Floods cause damage to buildings and infrastructure by simple inundation and by erosion. Defining the hazard associated with inundation by flooding is done by calculating the area likely to be flooded during different levels of flooding. Larger floods are less frequent than smaller floods, so flood levels are defined by their return period (which can also be expressed as the chance of the flood occurring during any one year). The longer the return period, the deeper the flood waters; hence the larger the area that is inundated. Some common return periods used in flood hazard mapping include 10-year, 25-year, 100-year, and 500-year floods. This map shows 25-year and 500-year floods. To model the 25-year and 500-year flood zones, methods documented by the Federal Emergency Management Agency (FEMA, 2011), U.S. Geological Survey (Cooper, 2005), and U.S. Army Corps of Engineers (USACOE, 2010) were used. See the accompanying report for more information.
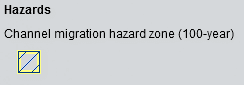 Channel migration. Channel migration hazards can occur slowly, for example by continuous erosion along a cutbank meander and deposition onto a point bar during high flows, or very rapidly during storm events through avulsion (the rapid abandonment of the current river channel for a new one) (Easterbrook, 1993; Rapp and Abbe, 2003). Such rapid migration can destroy structures and even remove the land under structures. In upper portions of drainages in the study area (that is, just below Mt. Hood), channels are dynamic, and migration can be catastrophic. Huge amounts of loose sediment are added to the fluvial system from frequent upslope debris flows. This loose sediment is easily eroded and transported during floods, amplifying the channel migration process downstream. During January 2011, heavy rainfall and rapid snowmelt caused the Sandy River channel to migrate, thereby destroying homes and roads. The 100-year channel migration zone was created for portions of Sandy River, Hood River, and portions of Middle Fork and East Fork Hood rivers following the methods described by English and Coe (2011; from Rapp and Abbe, 2003). This zone represents the maximum erosion expected to occur over a 100-year period. See the accompanying report for more information.
The
Map Viewer and Plate 4 [preview] contain flood and channel migration hazard data.
Flood and Channel Migration Hazards References:
- Cooper, R.M., 2005, Estimation of peak discharges for rural, unregulated streams in western Oregon: U.S. Geological Survey Scientific Investigations Report 2005-5116. Web:
https://pubs.usgs.gov/sir/2005/5116/
- Easterbrook, D.J., 1993, Surface processes and landforms: New York, Macmillan, 520 p.
- English, J.T., and Coe, D.E., 2011, Channel migration hazard maps, Coos County, Oregon: Oregon Department of Geology and Mineral Industries Open-File Report O-11-09, 18 p., 27 pl., scales 1:6,000 and 1:12,000.
- FEMA (Federal Emergency Management Agency), 2011, Region X Mitigation Division, Preliminary Flood Insurance Study for Coos County, Oregon and Incorporated Areas, 41011CV008, Washington D.C., April 27, 2011.
Lewis, D., 2007, Statewide seismic needs assessment: implementation of Oregon 2005 Senate Bill 2 relating to public safety, earthquakes, and seismic rehabilitation of public buildings, Oregon Department of Geology and Mineral Industries
Open-File Report O-07-02, 140 p. - Rapp, C.F., and Abbe, T.B., 2003, A framework for delineating channel migration zones: Olympia, Wash., Washington State Department of Ecology Publication 03-06-027, 65 p.
- USACOE (U.S. Army Corps of Engineers), 2010, HEC-RAS river analysis system, hydraulic reference manual, ver. 4.1: Davis, Calif., U.S. Army Corp of Engineers, Institute for Water Resources, Hydrologic Engineering Center, Computer Program Documentation (CPD) 69, 417 p. Web:
https://www.hec.usace.army.mil/software/hec-ras/documentation/HEC-RAS_4.1_Reference_Manual.pdf
- USDA SDS (U.S. Department of Agriculture, Soil Conservation Service), 1977, Flood hazard analyses, Lower Sandy River and Beaver Creek, City of Troutdale, Multnomah County, Oregon.
Earthquake Hazards [PDF of full viewer legend]
Earthquake effects are a significant threat in the study area and come from three main sources: the Cascadia Subduction Zone, crustal faults, and volcanic activity. When an earthquake occurs, seismic waves radiate away from the epicenter. The strength and duration of shaking at a site is dependent on the size of the earthquake, distance from the epicenter, and soil characteristics at the site. The damaging effects of earthquakes can be enhanced by amplification of shaking in soft soils, by liquefaction, or by earthquake-induced landsliding.
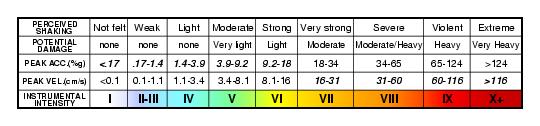
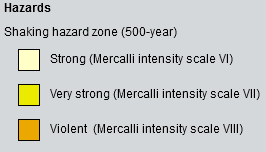 Shaking. The 500-year probabilistic shaking layer shows the estimated shaking strength from all sources and includes the likely amplification of ground shaking due to soft soils at a site. This level is displayed using the U.S. Geological Survey standardized ShakeMap (https://earthquake.usgs.gov/data/shakemap/) format, which presents likely ground shaking in terms of perceived shaking, potential damage, and the Modified Mercalli Intensity scale (see table). It provides the best available estimate of earthquake shaking that has a 0.2% chance of occurring in any given year. This is equivalent to a 500-year return period: statistically, earthquake shaking that occurs on average once every 500 years.
Modified Mercalli Intensity Scale
| Intensity | Effects |
|---|
| V | Felt by nearly everyone; many awakened. Some dishes, windows broken. Unstable objects overturned. Pendulum clocks may stop. |
| VI | Felt by all, many frightened. Some heavy furniture moved; a few instances of fallen plaster. Damage slight. |
| VII | Damage negligible in buildings of good design and construction; slight to moderate in well-built ordinary structures; considerable damage in poorly built or badly designed structures; some chimneys broken. |
| VIII | Damage slight in specially designed structures; considerable damage in ordinary substantial buildings with partial collapse. Damage great in poorly built structures. Fall of chimneys, factory stacks, columns, monuments, walls. Heavy furniture overturned. |
| IX | Damage considerable in specially designed structures; well-designed frame structures thrown out of plumb. Damage great in substantial buildings, with partial collapse. Buildings shifted off foundations.
|
Intensity Scale Source: USGS (Link)
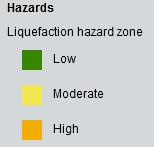 Liquefaction. During earthquake shaking, deposits of loose saturated silt, sand, and gravel can become ?liquefied,? thereby losing strength and thus the ability to support loads (Day, 2002; Kramer, 1996). Structures can tilt or sink, and soil can spread and flow on very gentle slopes, often moving inches to yards. The damage resulting from liquefaction can be far greater than that caused by earthquake shaking alone. Liquefaction hazards were evaluated using a classification system developed by Youd and Perkins (1978). This method takes into account the geologic environment of the soil deposition and the general age of deposits. For this study, liquefaction susceptibility classes were assigned on the basis of the dominant lithologies for each geologic unit in the study area and generalized into four relative hazard classes: Very Low to None, Low, Moderate, and High. If more detailed published studies were available for specific areas in the study area, data from those studies replaced the generalized data.
 Faults. This layer consists of faults from the Oregon Geologic Data Compilation, release 5 (Ma and others, 2009), Quaternary faults and folds in Oregon (Personius and others, 2003), and newly mapped fault scarps that were identified using lidar raster data.
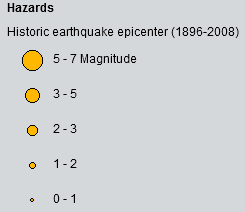 Earthquake epicenters. This layer was created by combining data from Niewendorp and Neuhaus (2003), the Pacific Northwest Seismic Network (PNSN, 2010), and the Advanced National Seismic System (ANSS, 2010). See the accompanying report for more information.
The
Map Viewer and Plate 5 [preview] contain earthquake hazard data.
Earthquake Hazards References:
- ANSS (Advanced National Seismic System), 2010, ANSS earthquake catalog. Web:
http://www.ncedc.org/anss/catalog-search.html
- Day, R.W., 2002, Geotechnical earthquake engineering handbook: New York, McGraw-Hill, 700 p.
- Kramer, S.L., 1996, Geotechnical earthquake engineering: Upper Saddle River, N.J., Prentice Hall, 653 p.
- Ma, L., Madin, I.P., Olson, K.V., Watzig, R.J., Wells, R.E., Niem, A.R., and Priest, G.R., compilers, 2009, Oregon geologic data compilation (OGDC), release 5 (statewide): Oregon Department of Geology and Mineral Industries, digital data, CD-ROM.
- Niewendorp, C.A., and Neuhaus, M.E., 2003, Map of selected earthquakes for Oregon, 1841 through 2002: Oregon Department of Geology and Mineral Industries Open File Report 03-02.
- Personius, S.F., Dart, R.L., Bradley, L.-A., and Haller, K.M., 2003, Map and data for Quaternary faults and folds in Oregon: U.S. Geological Survey Open-File Report 03-095, 579 p., 1 pl., scale 1:750,000.
- PNSN (Pacific Northwest Seismic Network), 2010, PNSN earthquake catalog. Web:
https://pnsn.org/pnsn-data-products/earthquake-catalogs
- Youd, T.L. and D.M. Perkins, 1978, Mapping liquefaction-induced ground failure potential: Journal of the Geotechnical Engineering Division, ASCE, v. 104, no. GT4, p. 433-446.
Assets
Community assets include all the things that make a community hospitable to inhabitation and usually include the people, institutions, land and everything on it, and the economy. In this study the assets are limited to people, generalized land use/zoning and buildings, critical facilities, and primary infrastructure.
Population [PDF of full viewer legend]
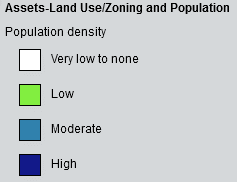
Population density can be difficult to define accurately on a map. However, population density is needed to accurately estimate losses from disasters. U.S. Census population data are organized from medium-size areas called blocks to large-size areas called tracts. In the study area, blocks can be as small as 5.5 million square feet (0.2 square miles; 500,000 square meters), and tracts can be as large as 12.5 billion square feet (450 square miles; 1.2 billion square meters). These areas are too large to be useful for estimating the distribution of population at a scale appropriate for risk analysis in the study area. A technique developed by Sleeter and Gould (2007a, 2007b) was used with 2000 census data (U.S. Census Bureau, 2000) and USGS land cover data (Homer and others, 2004) to create a gridded population density map. The data were divided into four population density classes: Very Low to None, Low, Moderate, and High. See the accompanying report for more information.
The
Map Viewer and Plate 7 [preview] contain gridded 2000 U.S. Census population data.
Population Density References:
- Homer, C., Huang, C., Yang, L., Wylie, B., and Coan, M., 2004, Development of a 2001 national land-cover database for the United States:Photogrammetric Engineering and Remote Sensing, v. 70, no. 7, p. 829-840. Web:
https://pubs.er.usgs.gov/publication/70156530
- Sleeter, R., and Gould, M., 2007a, Geographic information system software to remodel population data using dasymetric mapping methods: U.S. Geological Survey Techniques and Methods 11-C2, 15 p. Web:
https://pubs.usgs.gov/tm/tm11c2/tm11c2.pdf
- Sleeter, R., and Gould, M., 2007b. Downloadable dasymetric mapping tools, Arc Objects script ? ArcGIS 9.x
https://www.usgs.gov/centers/wgsc/science/dasymetric-mapping
- U.S. Census Bureau, 2000, United States Census 2000, geographic data products (census tracts). Web:
http://www.census.gov/
 Generalized Land Use/Zoning [PDF of full viewer legend]
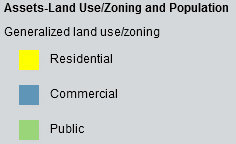
Evaluating risk includes understanding how land and the built environment might be affected in a disaster and what the economic impacts of that effect may be. In Oregon, all land is zoned into categories such as commercial, industrial, retail, public, green space, mixed use, high-density residential, and low-density residential. For this study, land use/zoning classes were combined into three generalized classes: commercial, residential, and public. Tax lot data from the Portland, Oregon, Metro Data Resource Center (Metro, 2010), Clackamas County (Clackamas County, 2009), and Hood River County (Hood River County, 2009) were combined to create the dataset. See the accompanying report for more information.
The
Map Viewer and Plate 6 [preview] contain generalized land use/zoning data.
Generalized Land-Use Zoning References:
- Clackamas County, 2009, 2009 tax lot dataset: Oregon City, OR, Clackamas County GIS Department, GIS dataset.
- Hood River County, 2009, 2009 tax lot dataset: Hood River, OR, Hood River County Public Works Department, GIS dataset.
- Metro (Portland, Oregon, metropolitan area regional government), 2010, Regional Land Information System (RLIS) GIS database: Portland, OR, Metro Data Resource Center. Web:
https://multco.us/gis/metros-regional-land-information-system-rlis
Critical Facilities and Primary Infrastructure [PDF of full viewer legend]
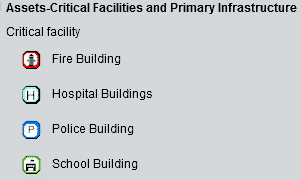
Critical facilities are typically defined as school buildings and emergency facilities such as hospitals and fire and police stations. Because of their function and capacity, these facilities are especially important should a disaster strike. The 104 critical facilities included in this study were extracted from the DOGAMI Statewide Seismic Needs Assessment (Lewis, 2007). Note that the earthquake exposure method used in this study includes only exposure of the location of the building to the seismic hazard at the building site; it does not include vulnerability data about the building. For vulnerability data, consult the building-specific
study by Lewis (2007)
Critical Facilities Reference:
- Lewis, D., 2007, Statewide seismic needs assessment: implementation of Oregon 2005 Senate Bill 2 relating to public safety, earthquakes, and seismic rehabilitation of public buildings, Oregon Department of Geology and Mineral Industries Open-File Report O-07-02, 140 p.
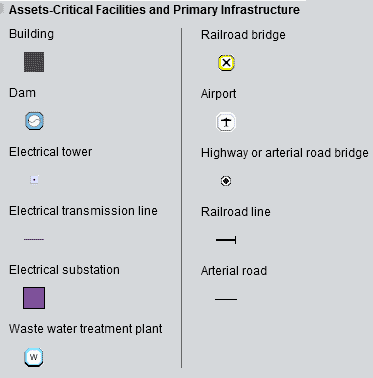
Primary infrastructure includes major electric transmission lines and substations, major dams and reservoirs, wastewater treatment plants, railroads and rail bridges, airports, and all highways, arterial roads, and bridges. See the accompanying report for more information.
The
Map Viewer and all map plates [preview] contain critical facilities and primary infrastructure data.