What is a Beach?
Beaches are dynamic landforms made up of small, loose sediments found next to large bodies of water (oceans and lakes). Their appearance, controlled by waves, currents and weather is constantly evolving. Some areas of the beach will gain sediment causing the shoreline to accrete while other areas will lose sediment causing shoreline erode.
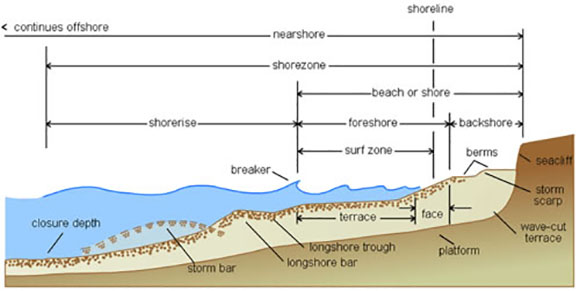
Common features found on beaches are:
-
Bar - an offshore ridge or mound of sand, gravel, or other unconsolidated material which is submerged (at least at high tide), especially at the mouth of a river or estuary, or lying parallel to, and a short distance from, the beach.
-
Berm - the nearly horizontal portion of the beach formed by deposition of sediment from waves
-
Backshore - the upper part of the beach above the normal reach of the tides, but affected by large waves occurring during a high tide.
-
Bluff - a high, steep bank or cliff
-
Dune - accumulations of windblown sand on the backshore, usually in the form of small hills or ridges, stabilized by vegetation or control structures.
-
Foreshore - sloping portion of the beach between the berm and the low water mark
-
Nearshore -an indefinite zone extending seaward from the shoreline well beyond the surf zone
-
Offshore - the comparatively flat zone of variable width, extending from the shoreface to the edge of the continental shelf
-
Shoreline - the line of demarcation between water and exposed beach
-
Surf zone - portion of the nearshore where waves begin to break. It extends into the swash zone
-
Tide - the periodic rising and falling of the water that results from gravitational attraction of the moon and sun acting upon the rotating earth
-
Trough - elongated depression extending parallel to the shoreline
Where Does Sediment Come From?
Characteristics of sediments found on the beach are controlled by the surrounding geology. They are typically derived from eroded inland landforms and carried to the beach by rivers. However, sediment can also be derived from erosion of local landforms in the backshore or even fragments of biologic organisms such as coral reefs or shell fragments. Sizes of these sediments can range anywhere from large cobbles to fine silt.
Waves
How Do Waves Form?
Although ocean waves can be generated by many factors such as the gravitational pull of the moon and sun (tides) and earthquakes/landslides (tsunamis), most waves that we see are produced by the wind blowing across the surface of the water. Just as when you create ripples in your cup by blowing across your coffee to cool it, the wind creates a disturbance in the ocean , generating waves that travel away from the wind. As waves travel, they become more regular and develop into swell, with more uniform heights and regular distances between crests. The longer and harder the wind blows, the larger the waves that are generated and the further they travel. It is not uncommon for waves generated by offshore storms to arrive at beaches located thousands of kilometers away.
Wave Characteristics
Waves transfer their energy through the water column in the form of circular orbital motions. This motion is associated with successive high (crests) and low points (troughs). The vertical distance between the crest and the trough is known as the wave height. The distance between any two corresponding crests is the wavelength. The time it takes one full wavelength to pass by a fixed point (like a pier piling) is the wave period. Therefore, the longer the wavelength, the faster the wave is traveling.

Breaking Waves
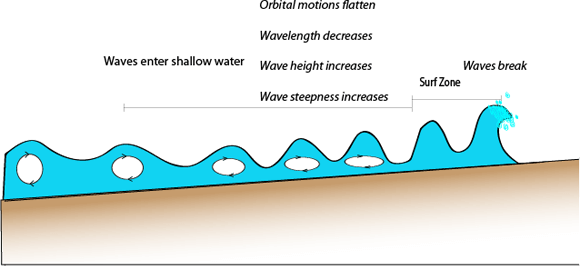
As waves approach the shore, they will eventually enter intermediate water (~ ½ the wavelength) and undergo physical transformations. First, the shallowing depths interrupt the orbital cycle, causing the wave to slow in speed. Because the waves behind the slowing wave are still traveling at the original speed, the wavelength also decreases. Despite the slowing of the wave, the energy must be maintained, causing the wave height to increase, becoming taller. A combination of an increased wave height with a decreased wavelength causes an increase in wave steepness (wave height divided by wavelength). When the wave steepness reaches a 1:7 ratio, the waves pitch forward and breaks, creating the surf.
How Are Waves Measured?
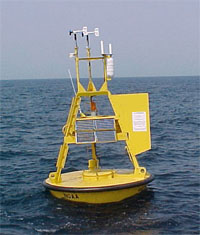
Offshore gauges are the most typical way to measure waves. Large buoys anchored to the ocean floor are equipped with instruments to measure variables such as significant wave height (average 1/3 of the highest waves within a specified time period), wave direction, wave speed, water temperature, etc. As they rise and fall with each passing crest and trough while keeping track of their position in space, they are actually also recording the movement of the ocean surface.
For more information on offshore wave buoys and their data, check out the
NANOOS Visualization System.
Waves of the Pacific Northwest
How big?
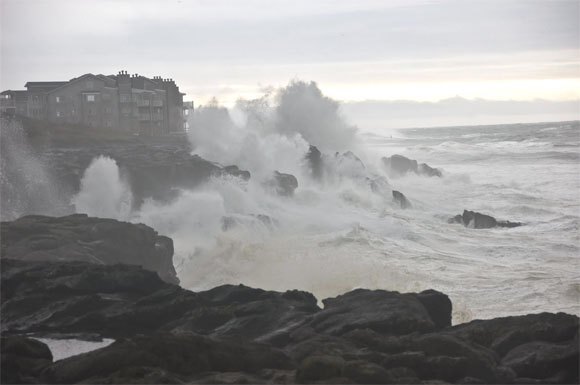
The average wave heights during summers offshore the Oregon coast are around 1.4 meters (4.6 feet). Winter storms cause these wave heights to increase to be an average of 3 meters (9.8 feet). Although large storms commonly generate significant wave heights of 10 meters (32 feet), the largest recorded significant wave height occurred offshore of the Columbia River when a storm in December of 2007 produced a wave with a magnitude of 14.6 meters (47.9 feet)!!
How fast?
Typical summer waves travel at speeds of 10-15 meters per second (22 - 33 miles per hour). Winter storms generate larger seas with waves that travel 15-30 meters per second (33 - 65 miles per hour).
Where are they coming from?
Waves reach the Oregon coast from storms all over the Pacific Ocean--even from the Southern Hemisphere near Antarctica! While summer waves are typically smaller and approach the coast from the Northwest, the largest waves are produced by winter storms that travel down from the Gulf of Alaska and cause waves to approach from the Southwest.
Getting bigger?
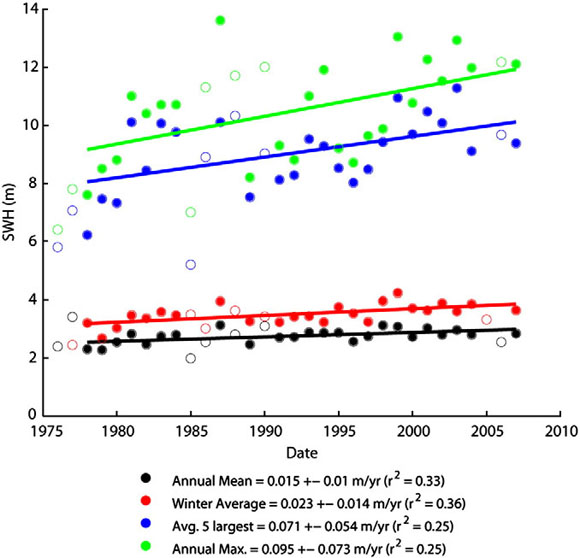
Analysis of offshore buoys extending back to the mid-1970s through the year 2007 suggest that average significant wave heights have been increasing at a rate of approximately 0.015 meters/year (0.05 feet/year). However, this rate increases to 0.023 meters/year (0.08 feet/year) if we only look at the waves recorded during the winter months and 0.095 meters/year (0.31 feet/year) if we only look at the largest events each year. Putting these numbers into perspective, the winter waves and largest annual storm events are increasing at rates 1.5 and 6.3 times the rate of the annual average respectively!
While these increases are most likely due to the Earth's evolving climate, uncertainty remains as to whether they are a product of human-induced warming or are caused by natural multi-decadal climate cycles. One thing that is certain, if these rates continue to increase in the future, episodes of coastal erosion and flooding will become larger and more frequent. This information is also important for the design of engineering structures such as jetties,riprap construction and even the design of boat hulls--all of which are designed for use in specific wave conditions.
Tides
Tides are the rise and fall of the sea controlled by the combined effects of the moon and (to a lesser extent) the sun's gravitational pull on the Earth. A monthly tidal cycle is 29.5 days because this is how long it takes the Moon to orbit the Earth. Because it is the Moon's position around the Earth that most greatly affects tidal conditions, it would seem that all beaches should experience two high tides and two low tides a day. However, many additional factors such as water depth and sizes of oceans and local bathymetry can affect tidal patterns. Therefore, the number and magnitude of tidal occurrences varies geographically.
Tides Vary Geographically
-
Diurnal tides - a single high and low tide each day These are common in shallow seas such as the Gulf of Mexico and have a tidal period of 24 hours and 50 minutes.
-
Semi-diurnal tides - two high tides and two low tides each day that is of the same magnitude An example of where this tidal pattern occurs is the U.S. Atlantic Coast. The tidal period is 12 hours and 25 minutes.
-
Mixed tides - two high tides and two low tides each day, but are of very different magnitudes These are the most common tidal patterns in the world, including the Oregon coast. Similar to the semi-diurnal tides, mixed tides experience a tidal period of 12 hours and 25 minutes, although some beaches may have a diurnal tidal period as well.
 Images from NOAA Ocean Service Education
The greatest tidal ranges occur during spring tides, which are during a new and full moon. As shown below, during these moon phases, the moon and sun are in alignment and combine forces to create a large vertical difference at low and high tide. In contrast, the smallest tidal range occurs during neap tides when the moon is in its first and last quarter phase. At these Moon phases, the sun is at a right angle to the moon, creating small vertical differences in the tides.
How Do We Predict Tides?
Because we have long records of astronomical patterns and their control on tides, we are able to predict tidal levels at a fairly accurate level. However, factors such as currents, topography and strong winds may have a strong influence and must therefore be accounted for. In the US, the Center for Operational Oceanographic Products and Services (CO-OPS) makes more accurate predictions by relying on a network of 140 reference stations, which record tide gauge measurements every 6 minutes. Comparison of the geographic differences of these measurements is then used to calculate what the tide levels should be at the ~3000 additional stations located throughout the coast.
Why Are Predicted Tides Different Than What We Actual Observe?
Tide gauges established along the coast record hourly measurements of tidal elevation, but they can often deviate slightly from the predicted levels. This is primarily due to other factors such as storm surge, changes in barometric pressure, winds, and an increase in water flow from regional rivers/rainfall.
Oregon Tides
The Oregon coastline experiences a mixed semi-diurnal tidal pattern. On average, the vertical range is approximately 1.5-2 meters (5-6 feet). However, extreme spring tides can produce tidal ranges that are 3-4 meters (10-12 feet) – double the magnitude!
Along the rocky sections of the coastline, low tide reveals a glimpse into the life of colorful, often other-worldly, organisms that thrive in the coastal environment. Common to these tidal pools are sea anemones, urchins and sea stars as well as a variety of sea birds.
For more information about tides and to find the times of high and low tides in your area, visit
NOAA's Tides and Currents website.
Sediment Transport
Sediment transport in the littoral zone can be divided between the movement of sediments that is directed in primarily onshore-offshore directions (cross-shore sediment transport), and the movement of sediments parallel to the beach (longshore transport). The latter is especially significant when waves approach the shore at an angle as they then generate stronger currents confined to a narrow zone landward of the breaker zone and can be responsible for the movement of substantial volumes of sand along the shore, including significant quantities of gravels and cobbles.
On the Oregon coast the role of longshore currents is especially important due to a seasonal variation in the direction of wave approach between the summer and winter. During a "normal year", summer waves, driven by north to northwesterly winds, approach the coast from the northwest, transporting large volumes of sand and fine gravel towards the south ends of the cells, and also landward causing the dry portion of the beach to build out. In contrast, the arrival of large waves from the southwest during the winter results in a reversal in the net sediment transport direction, which is now directed toward the north, as well as cutting back the dry summer beach by moving the sand back offshore. Over several "normal" years there can be an equilibrium balance such that the net sediment transport is close to zero (i.e. there is no net long-term build up (accretion) of sediment at either end of the littoral cells) (Komar, 1986).
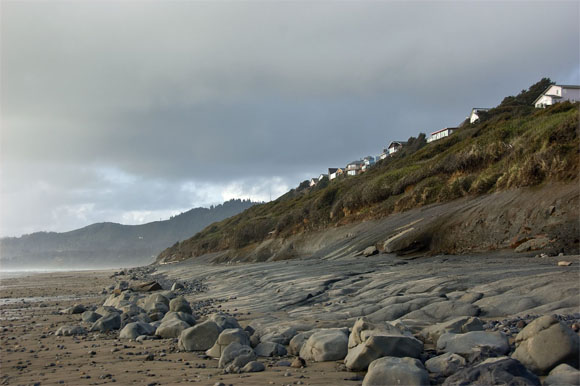 Seasonal erosion of Beverly Beach, OR in February 2009
The volume and direction of sand and gravel transported along Oregon's littoral cells may be enhanced due to the occurrence of an El Niño. In addition to elevating normal water levels, El Niños result in a southward shift of the storm tracks so they mainly cross the coast of central California. As a result, storm waves reach the Oregon coast from a more southwesterly direction, creating an abnormally large northward transport of sand within its littoral cells. This creates "hotspot" erosion at the southern ends of the cells, north of the bounding headlands and also north of migrating inlets, shown conceptually below. The opposite response is found south of the headlands, where the northward displaced sand accumulates, causing the coast there to locally advance seaward.
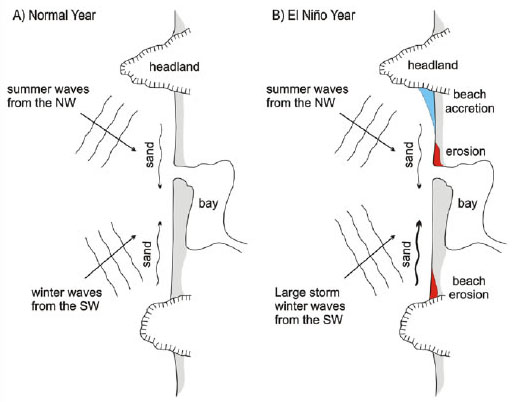 The alongshore movement of beach sediments on the Oregon coast for a typical year (left) and an El Nino year (right).