Map Tools
Get to Know the Map Interface
Zoom In and Out and Move Around the Map
Go to an Address
Show/Hide Map Layers
Change the Transparency of Layers
Click on the Map to Get Pop-Up Information
Change the Basemap
Measure Distances and Areas
Find the Latitude and Longitude of a Location
Export or Print a Map
Layer Information
Downloadable Tiles
Project Areas
Bare Earth Elevation
Bare Earth Slope (degrees)
Lidar Canopy Height
Highest Hit Lidar Hillshade
Bare Earth Lidar Hillshade
Get to Know the Map Interface
Look around the interface to familiarize yourself with all its features and tools. Hover your cursor over buttons and click them to see what you can do. Close windows by clicking on the "X" in the upper right of the window.
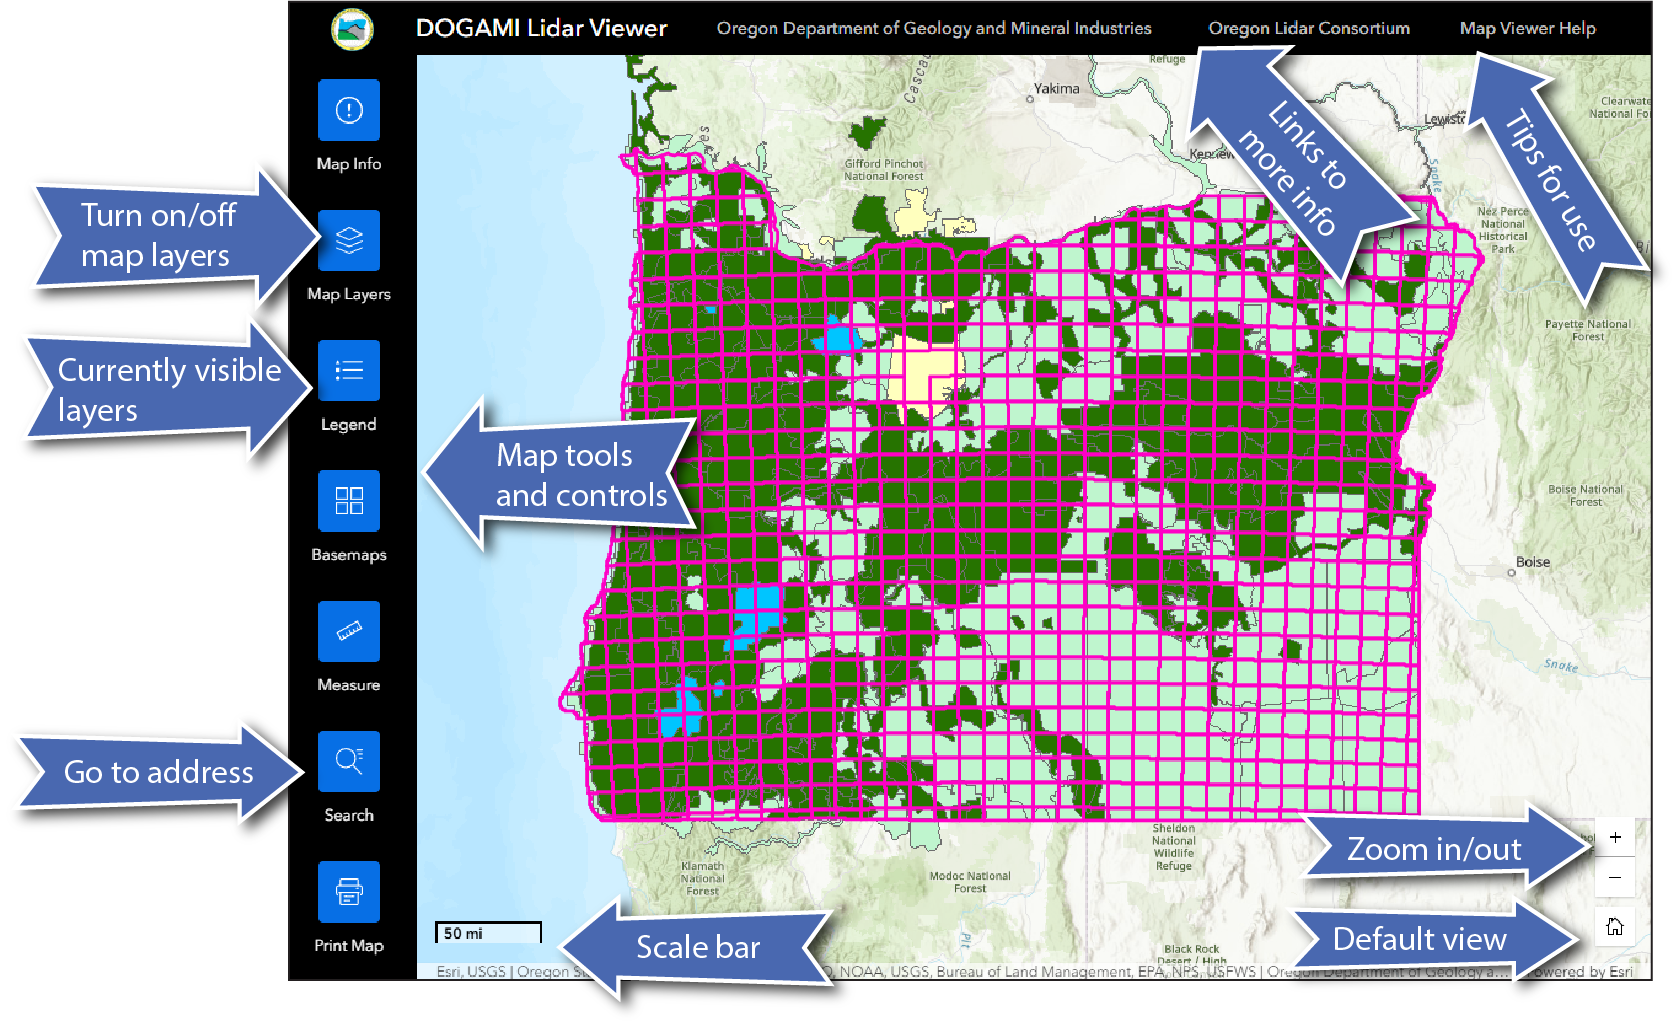
Zoom In and Out and Move Around the Map
Use the zoom controls to move to preset scales. You can also zoom in and out by using the roller wheel of your mouse. Pan around the map by clicking and holding down the mouse button while dragging the cursor around the map. Reset the map to the default opening scale and extent by clicking on the Home button.
Go to an Address
Type an address in the "Find address" field to zoom to that location. As you type, some suggested locations will appear. Be sure to choose the Oregon address! Click on the desired result and the map will be zoomed into that location. You can also input arbitrary locations as decimal latitude, longitude values.
Show/Hide Map Layers
Toggle the checkbox next to a layer to turn it on and off. The higher-level layer must be toggled on for a sublayer to display, even if you have checked a sublayer's checkbox. Click on the down-pointing arrow to the left of a layer to see what's in that layer. Click on the down arrow to the right of a layer to see options for that layer.
Change the Transparency of Layers
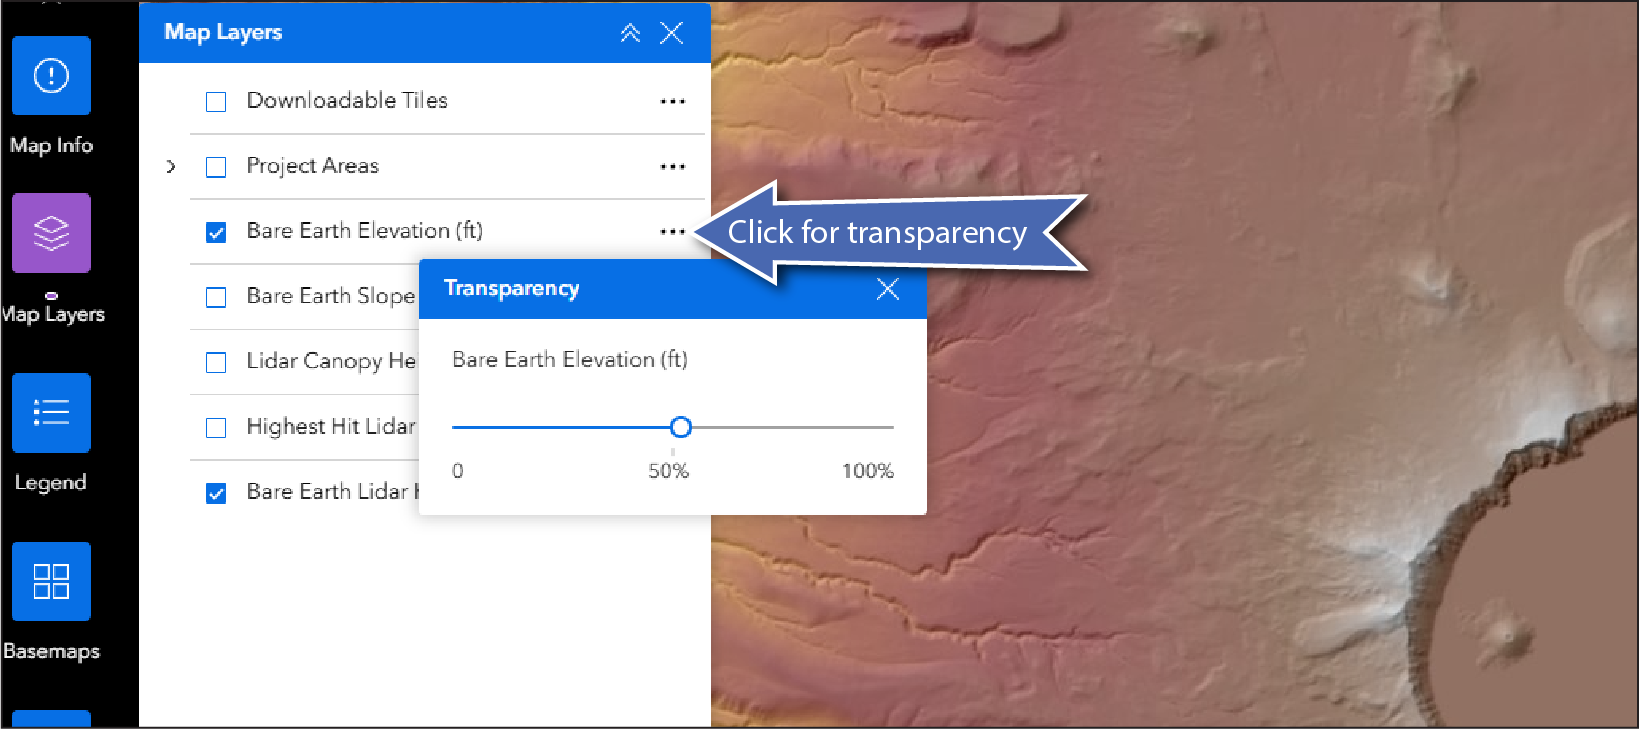
Making a higher layer partially transparent can be useful for visualizing combinations of rasters such as elevation over a hillshade (example above), canopy height over the surface model, or project areas over topography or a basemap. To change the transparency of a layer, click on the three-dot symbol to the right of a layer name. This opens the transparency slider, which can be adjusted to the desired level. For Project Areas, the transparency control is available at the higher level “Project Areas” layer rather than individual sublayers.
When you click anywhere on the map, a pop-up window appears. The content of the pop-up window depends on which layers are showing. If many layers are showing, the top or bottom bar in the window will display arrows to sequentially click through the layer information (even if lower layers are covered by opaque layers above). Layer information appears in the order the layers are displayed in the Map Layers legend. Clicking the “X” in the upper right will close the pop-up window.
Clicking in another location will reorganize the window. For further details about data displayed in individual layers, see Layer Information below.
For instance, in the screenshot below, five different layers are selected, and the map viewer is displaying the top selected layer in this location, Downloadable Tiles.
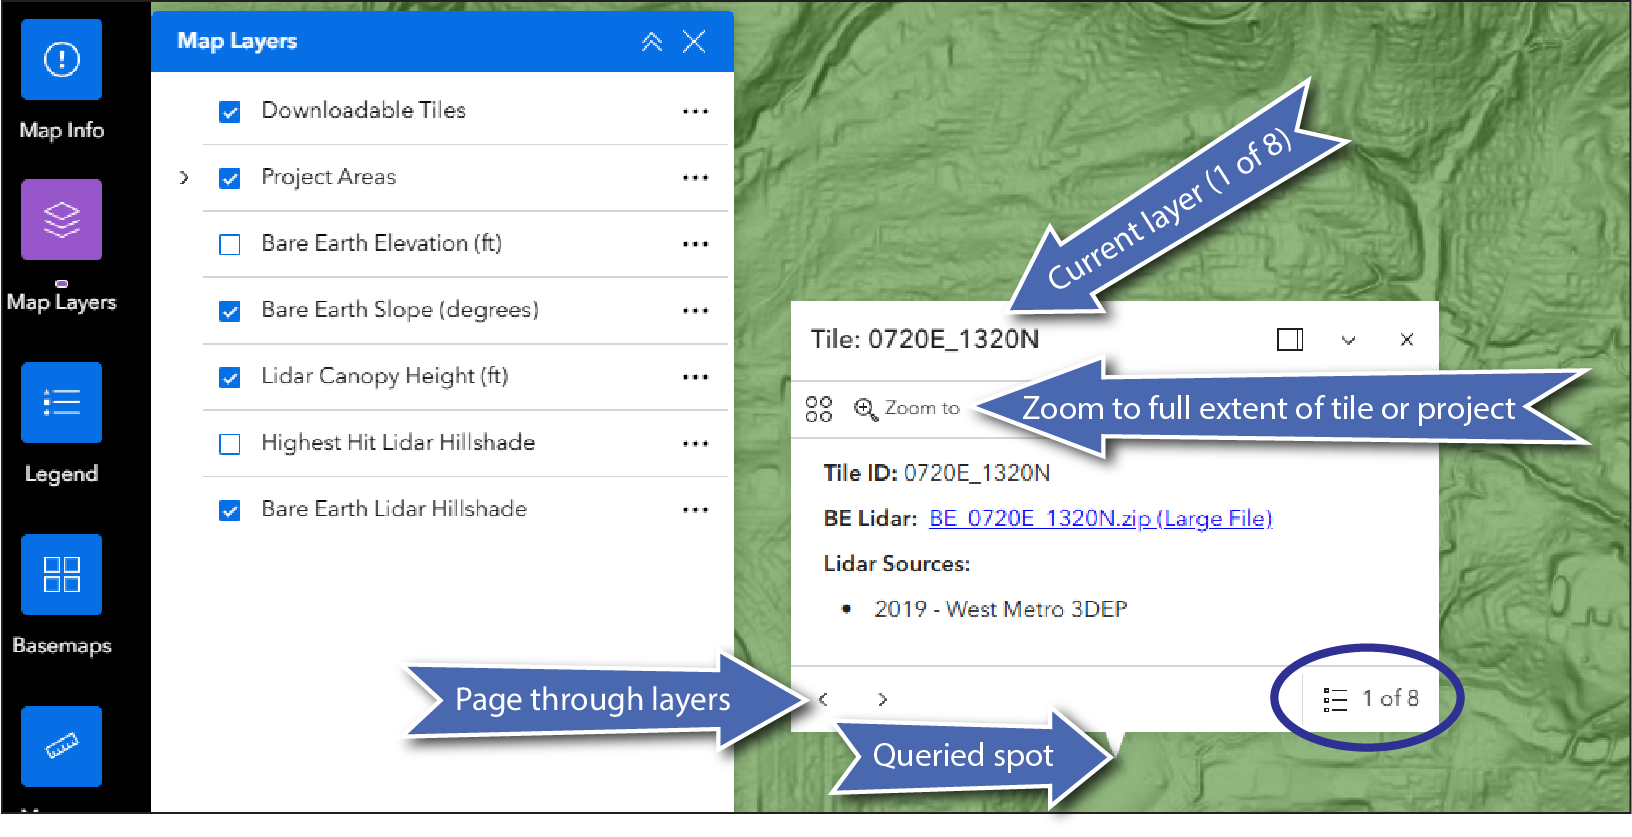
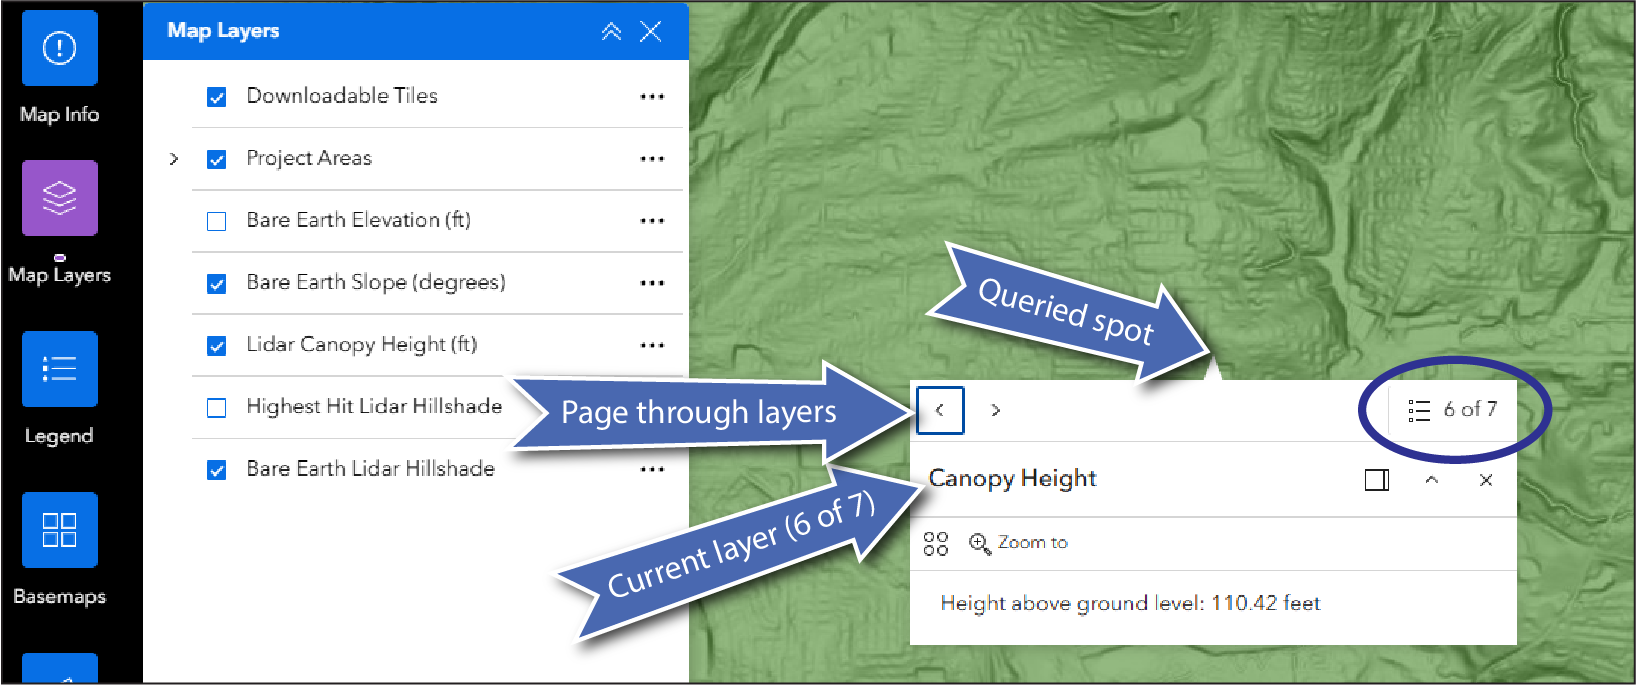
By clicking through the layers using the arrows at the bottom left-hand corner of the pop-up window, you can view the other selected layers at this point location, as well as location-specific values associated with that layer. For instance, looking at the Canopy Height layer at this location, shown below, reveals that the canopy is 110.42 feet above ground level. Note that in this particular view, the Canopy Height layer is hidden behind the displayed Project Areas layer (partially transparent) and the Bare-Earth Slope layer (opaque).
Change the Basemap
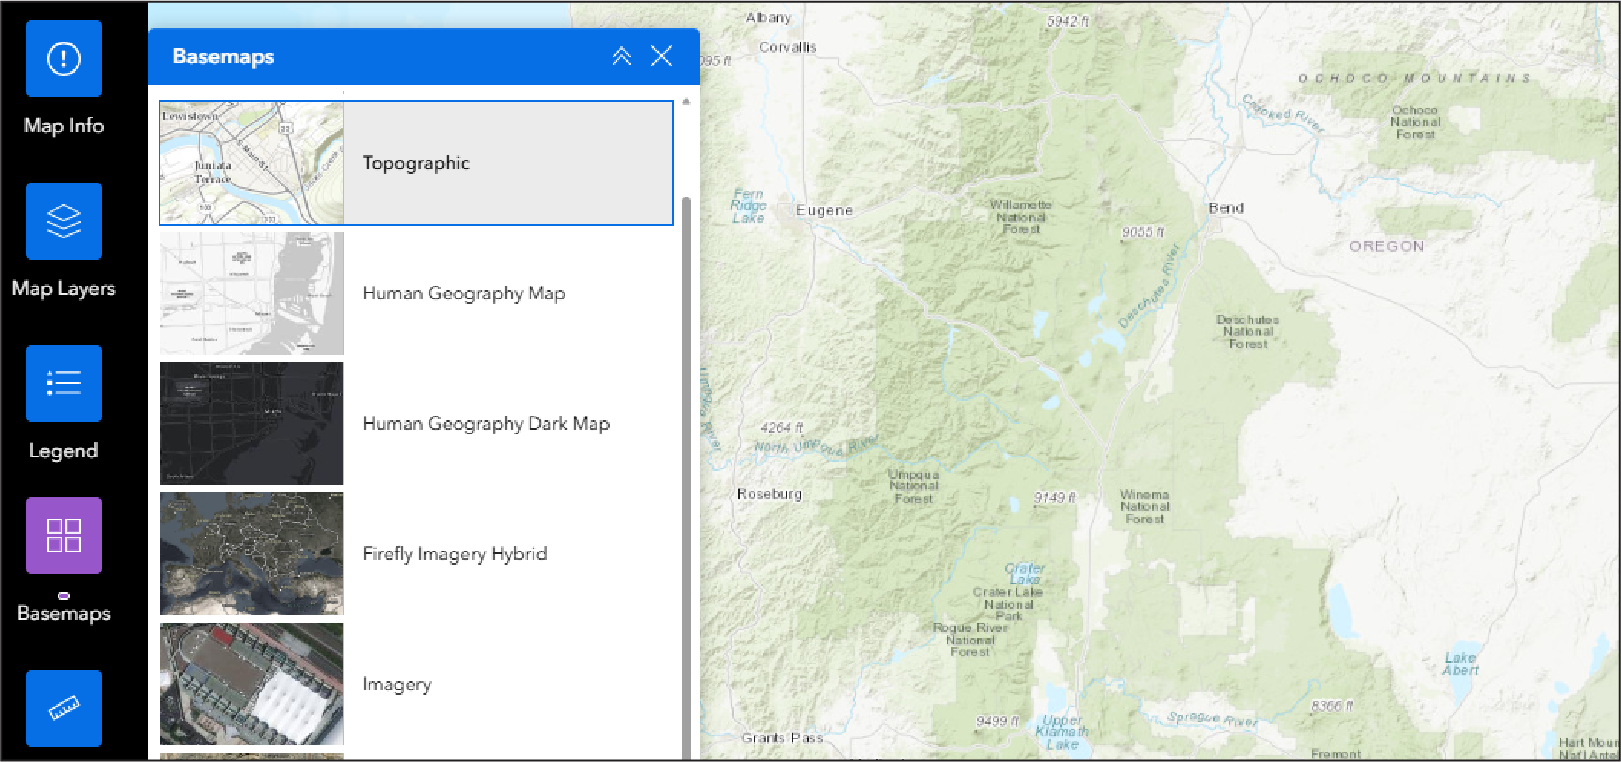
Multiple basemaps are available to meet a range of preferences. Clicking on the Basemaps button in the left-hand vertical ribbon brings up the different options.
Measure Distances and Areas
You can measure areas and distances on the Lidar Viewer map. Click on the Measure tool button, then select either Distance or Area. Select the units to be used for the measurement; you can also change the units after a line or area is selected. To clear a measurement or start a new measurement, click "Clear Measurement" at the bottom of the Measure tool window.
Measuring Distance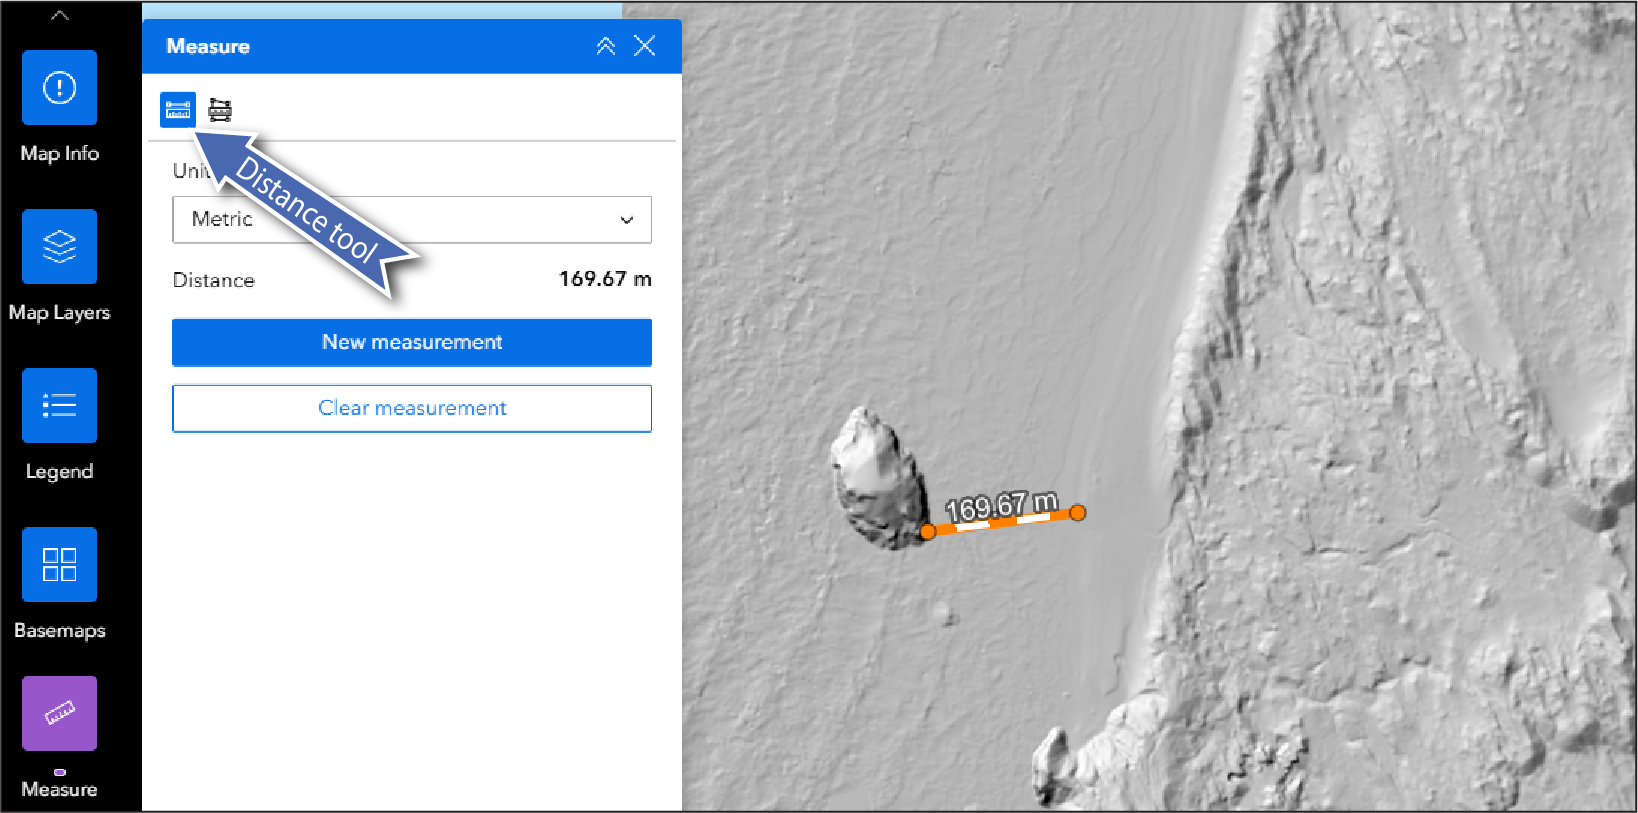
To measure a distance, choose the Distance option, then click on the map to start the measurement. Move the cursor, and double-click the endpoint to complete a straight-line measurement. To measure a sinuous feature, continue single-clicking along the line and double-click at the endpoint to complete the full multi-point line.
Measuring Area
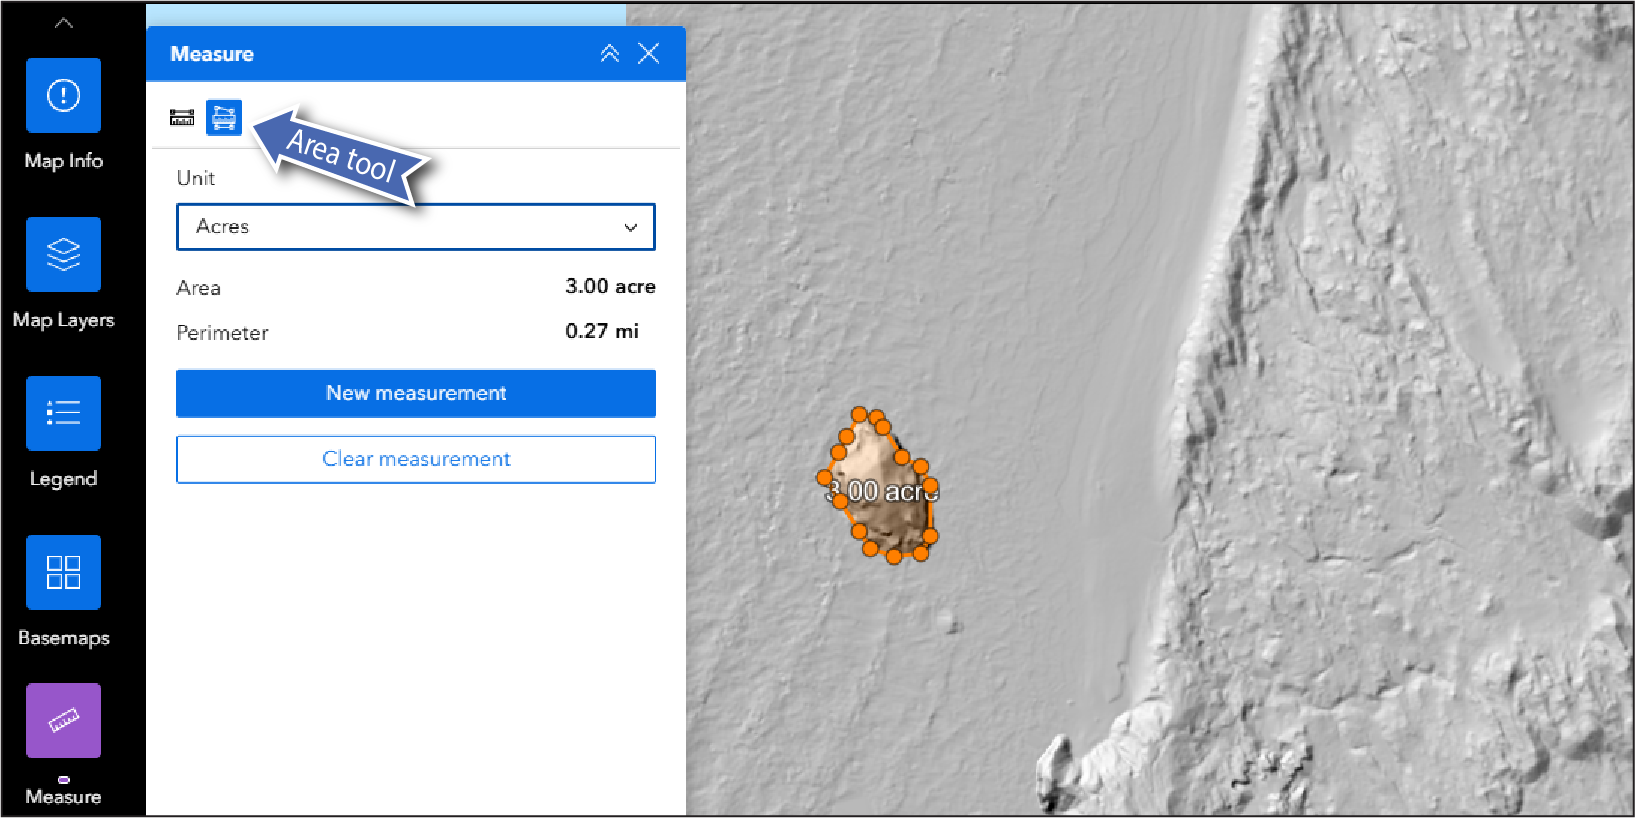
To measure an area, select the Area option in the Measure tool window, and click around the target feature. Double-click to complete the measurement.
Find the Latitude and Longitude of a Location

The Map Info tool window contains a tool that displays the longitude, latitude location of the cursor. When the Map Info window is activated, the longitude and latitude text will update to show the current position of the cursor if it is over the map window.
To find the location of a specific point, click the “+” icon (marked “Click to select point” in graphic above) and then click the desired location on the map. Once the spot is clicked, a marker will be shown, and the coordinates of the marker will be displayed. These coordinates can be copied to the clipboard by clicking the icon to the right.
To clear the marker and return to the original behavior, click the “+” icon again.
Export or Print a Map
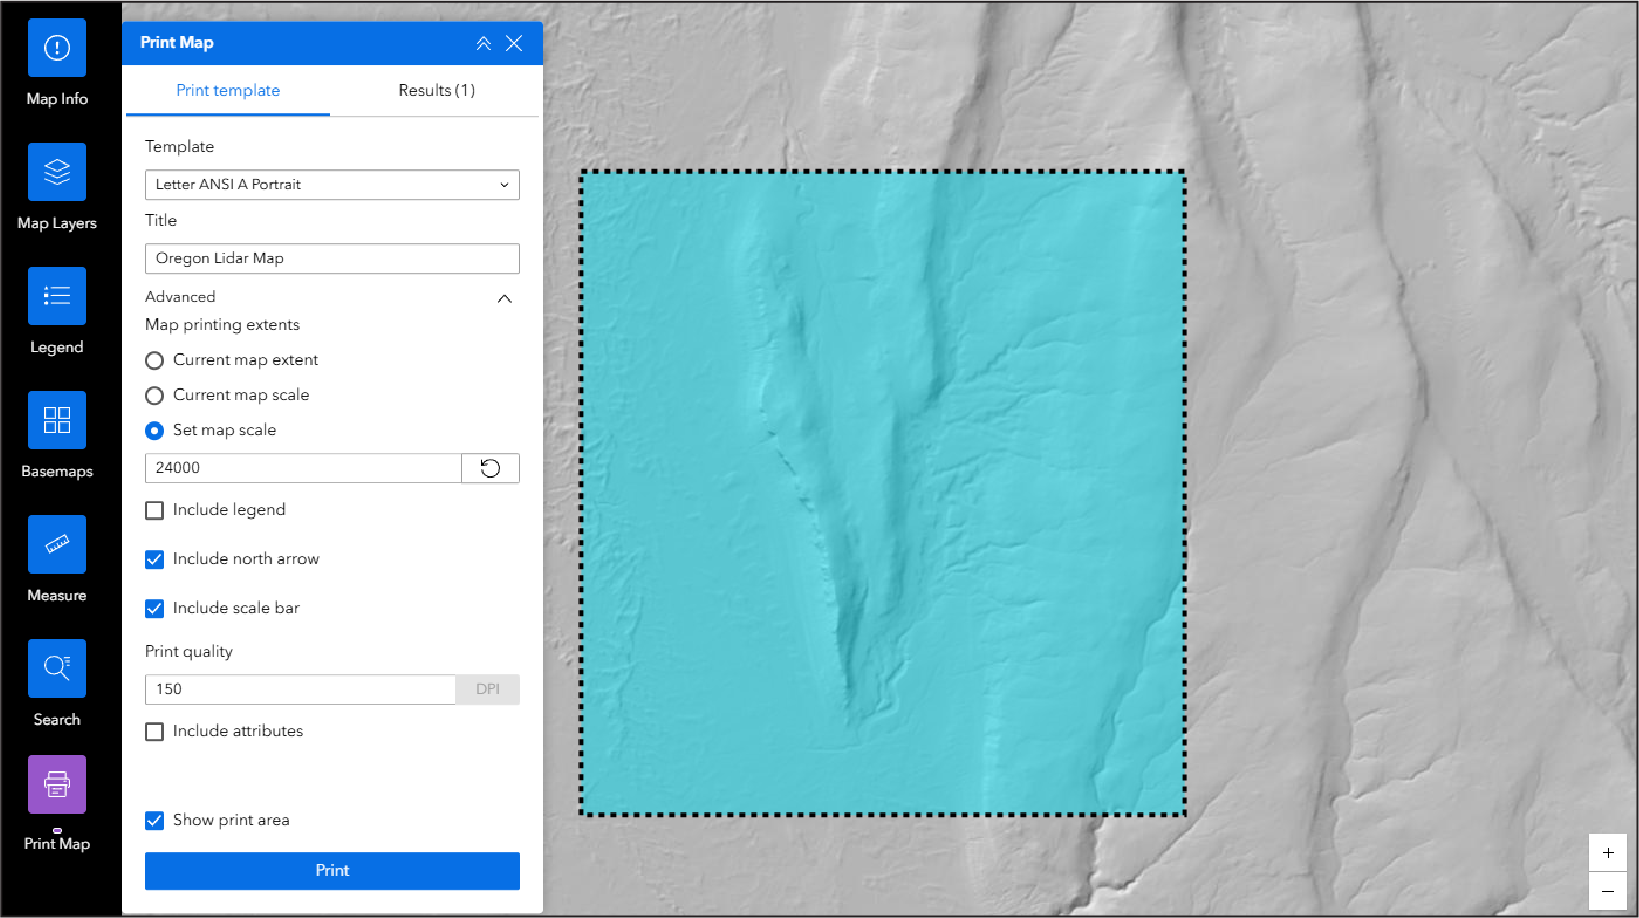
To export or print a map to as a geo-coded PDF file, follow the proceeding steps:
-
Click on the “Print Map” tool button (lowest button on the tool strip at left side of map).
-
Choose the template for the map you want to print, such as portrait or landscape for letter-sized documents (8.5" x 11") or tabloid-sized documents (11.5" x 17").
-
Click the downward-pointing arrow to the right of “Advanced” to show additional options related to map scale, scale bar, north arrow, and image resolution.
-
We recommend leaving "Include legend" unchecked as the legend capabilities for maps are currently limited in the print interface and generally uninformative. Taking a screenshot of the viewer window with the Legend subwindow activated is a workaround to save a separate legend.
-
Select “Show print area” option to define the map extent based on page size/orientation, scale, and current map center position (see example image for using a specified scale).
-
Click the blue “Print” button to generate a PDF version of the map, which will appear in the “Results” tab of the Print window.
-
To download PDF files, right-click the filename of the map in Results and choose the “Save Link As” option. The PDF files can then be printed or used digitally offline.
-
If desired, click the “X” to the right of an exported map name to remove the map from the list in the “Results” tab.
-
Click the Print Template tab again to allow export of additional maps.
Downloadable Tiles
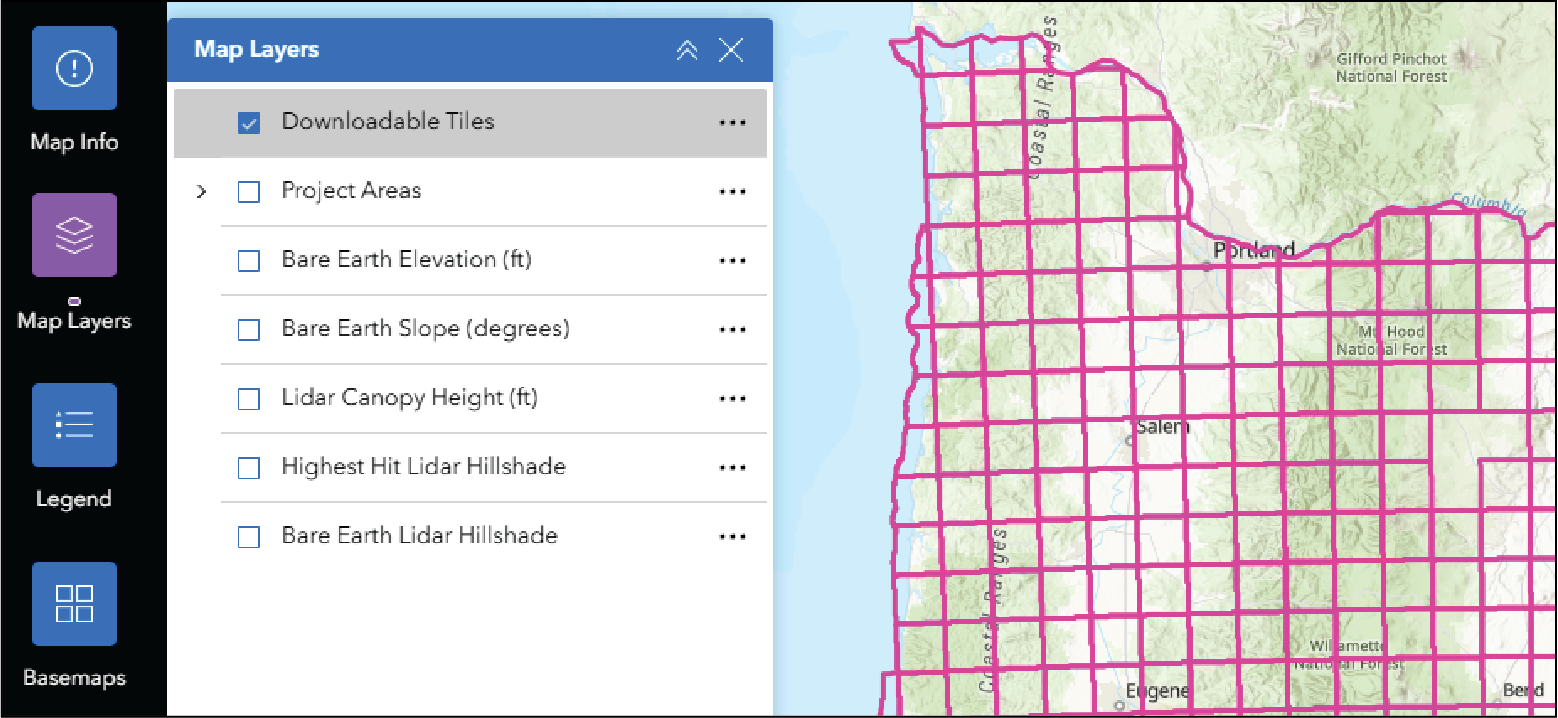
This layer shows bare-earth mosaic lidar data available for download in 60,000 x 60,000 feet square tiles (~18.3 km square). Clicking in a tile will bring up a window with the link to download data and information about projects.
Note: Legacy lidar data quadrangle publications are also available on DOGAMI's Lidar Data Quadrangles webpage. Publications can be found here by searching for the USGS Quadrangle name or grid code.
Map Projection
The lidar data and the tiles are in the
Statewide Oregon Lambert projection. Note that because the web map uses a Web Mercator projection, the square tiles appear distorted.
Data Format
Data are in compressed (.zip) file format with three components per tile: 1) 3-foot resolution bare-earth raster data in geotiff format, 2) a shapefile that shows the extents of the lidar projects that are locally contributing data to the mosaic, and 3) a brief ReadMe file.
Viewing Data
The data are best viewed using specialty GIS software capable of viewing .shp and .tif formats.
Project Areas
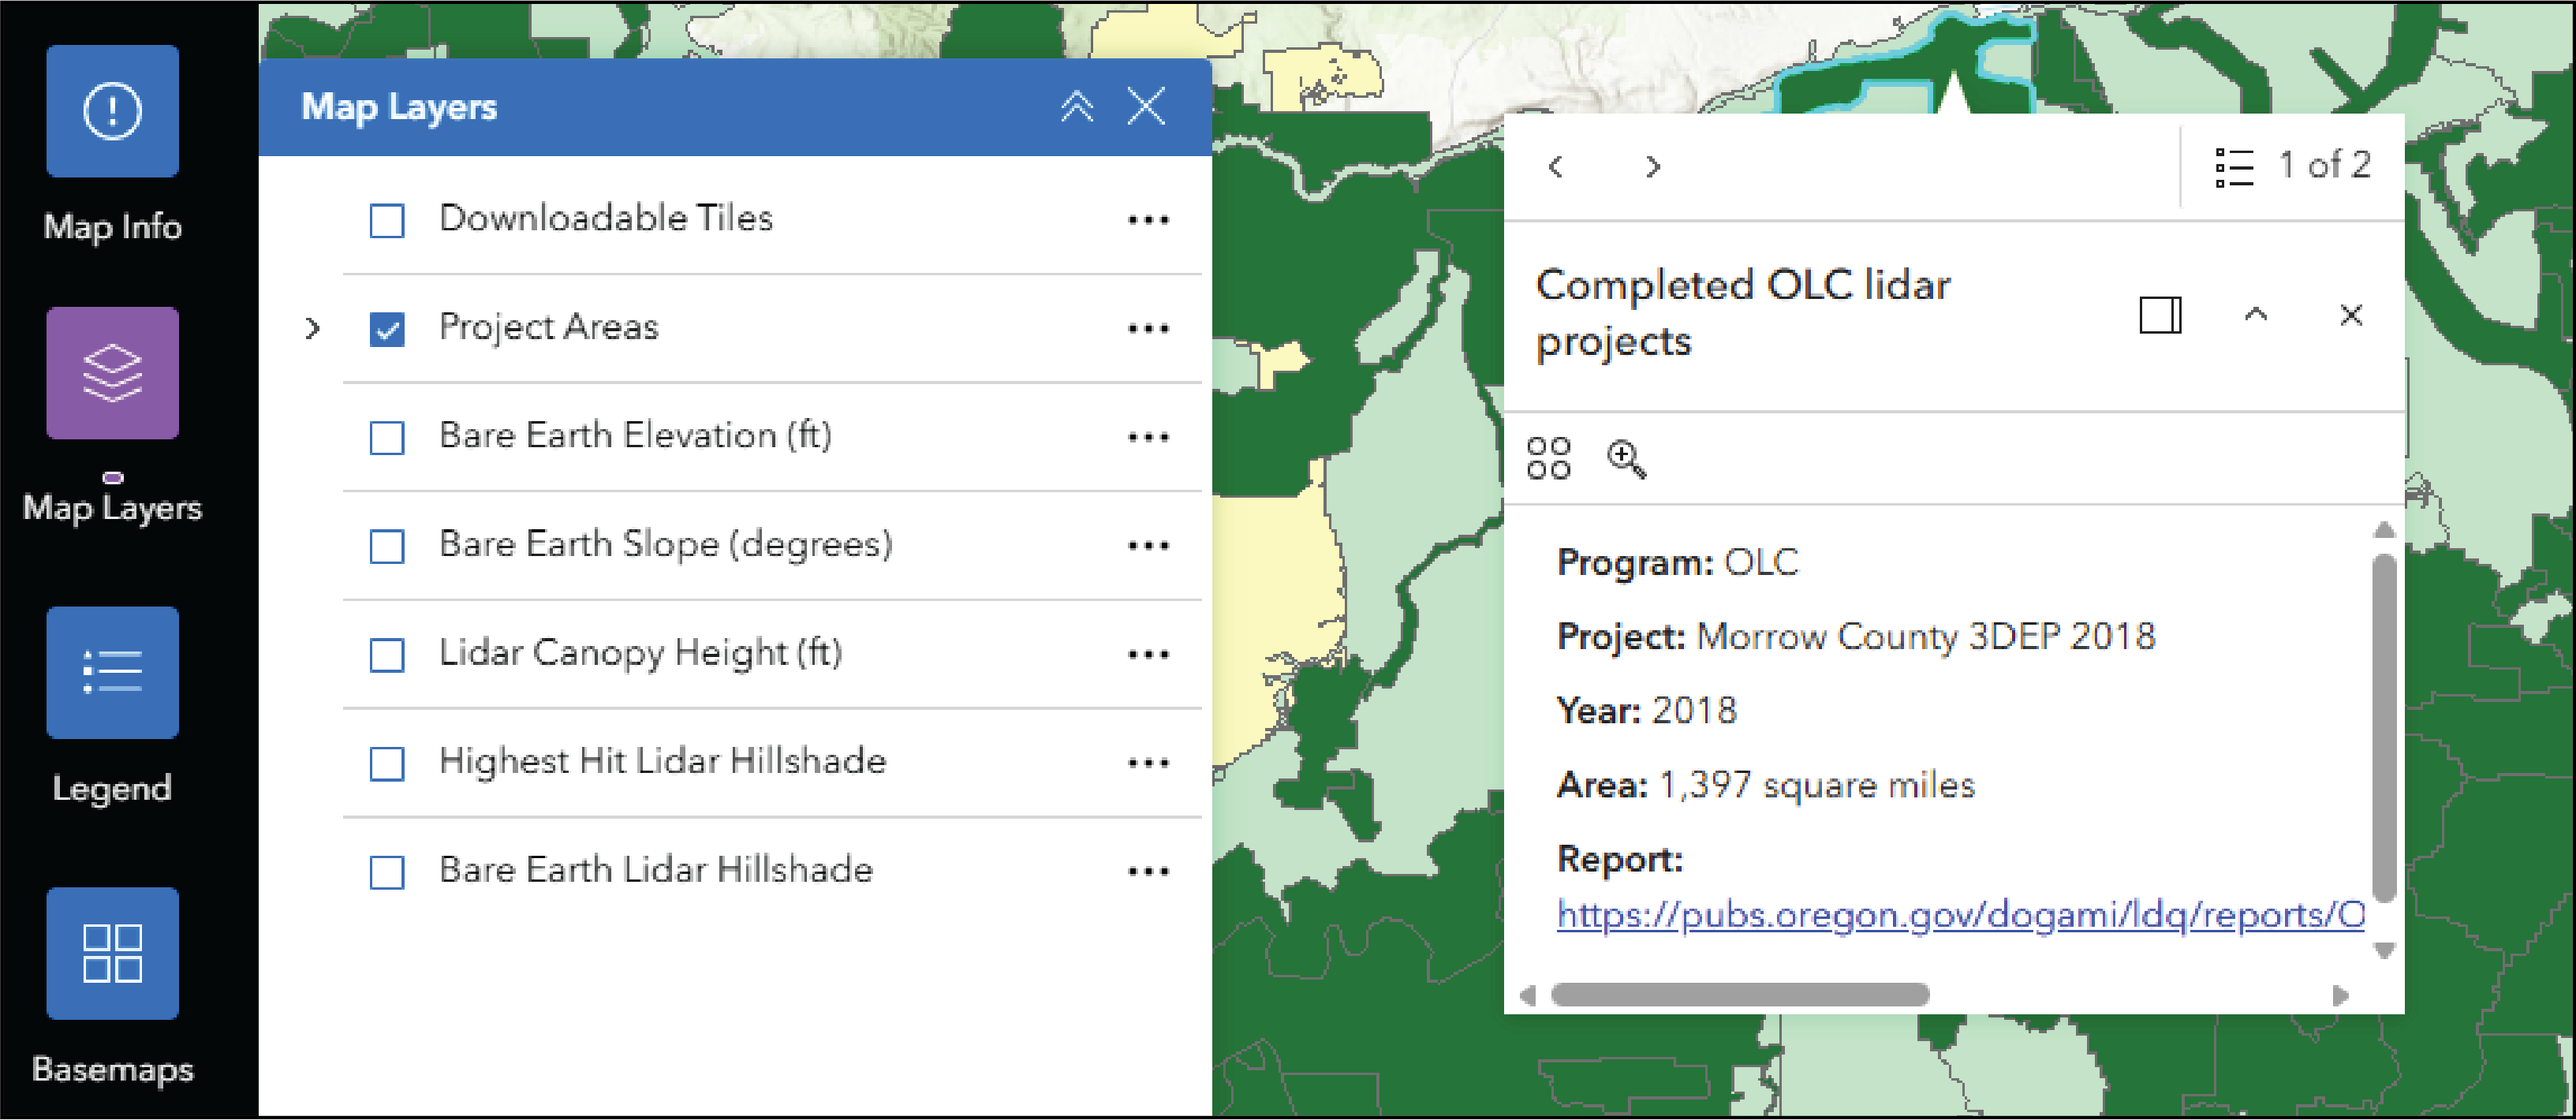
The Project Areas layer shows the spatial extent of the following project types:
-
In-progress Oregon Lidar Consortium (OLC) projects
-
Completed OLC lidar projects
-
Non-OLC in-progress lidar projects
-
Non-OLC completed lidar projects
The project types are organized into sublayers that are superimposed in the map. These sublayers can be turned on and off. Clicking in the map will bring up details about the project or projects covering that location. If multiple projects overlap the clicked point, the pop-up window will display entries with information for each project, like the point shown above. To view each project, click through using the arrows in the upper left-hand corner of the pop-up window.
Bare Earth Elevation
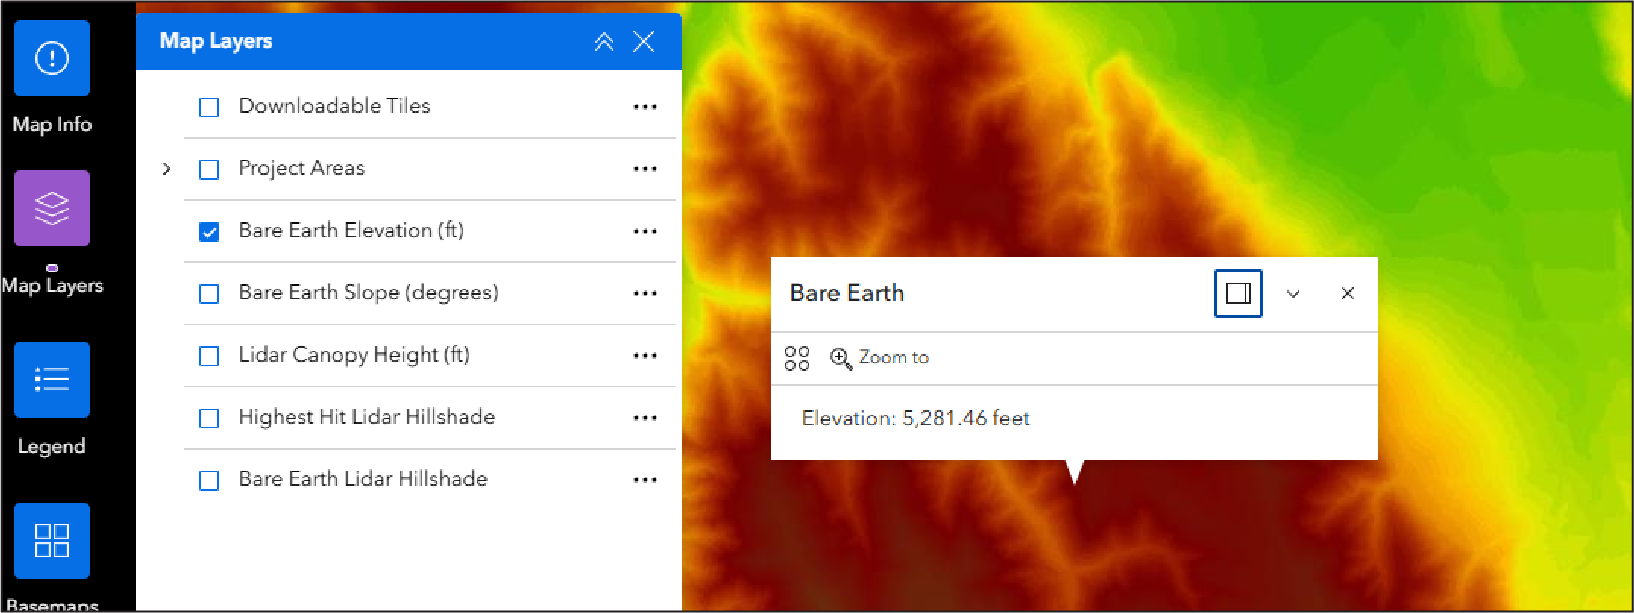
The Bare Earth Elevation layer shows ground elevation from the most recent project in a mosaic across the state. Clicking in the map generates a pop-up window showing the Bare-Earth elevation at the queried point.
Elevation Range and Visualization
The range of elevation values spans 0–9000 feet to emphasize typical statewide variability. In the map viewer, elevation is dispayed using a color ramp with cool green colors indicating low elevations to warm red colors indicating high elevations. Any areas with an elevation of over 9000 feet are displayed as a uniform white up to the highest elevation in the state, the summit of Mount Hood (11,244 ft as measured in the 2009 OLC Hood to Coast project).
Data Source
The Bare Earth Elevation layer is a digital terrain model (DTM). The DTM is a bare-earth model where all trees, vegetation, buildings, and other human-made structures have been removed, leaving only the bare ground beneath.
The bare earth DTM is derived from irregularly spaced ground lidar points to make a model of the ground surface at a typical grid resolution of 3 feet.
Bare Earth Slope (degrees)
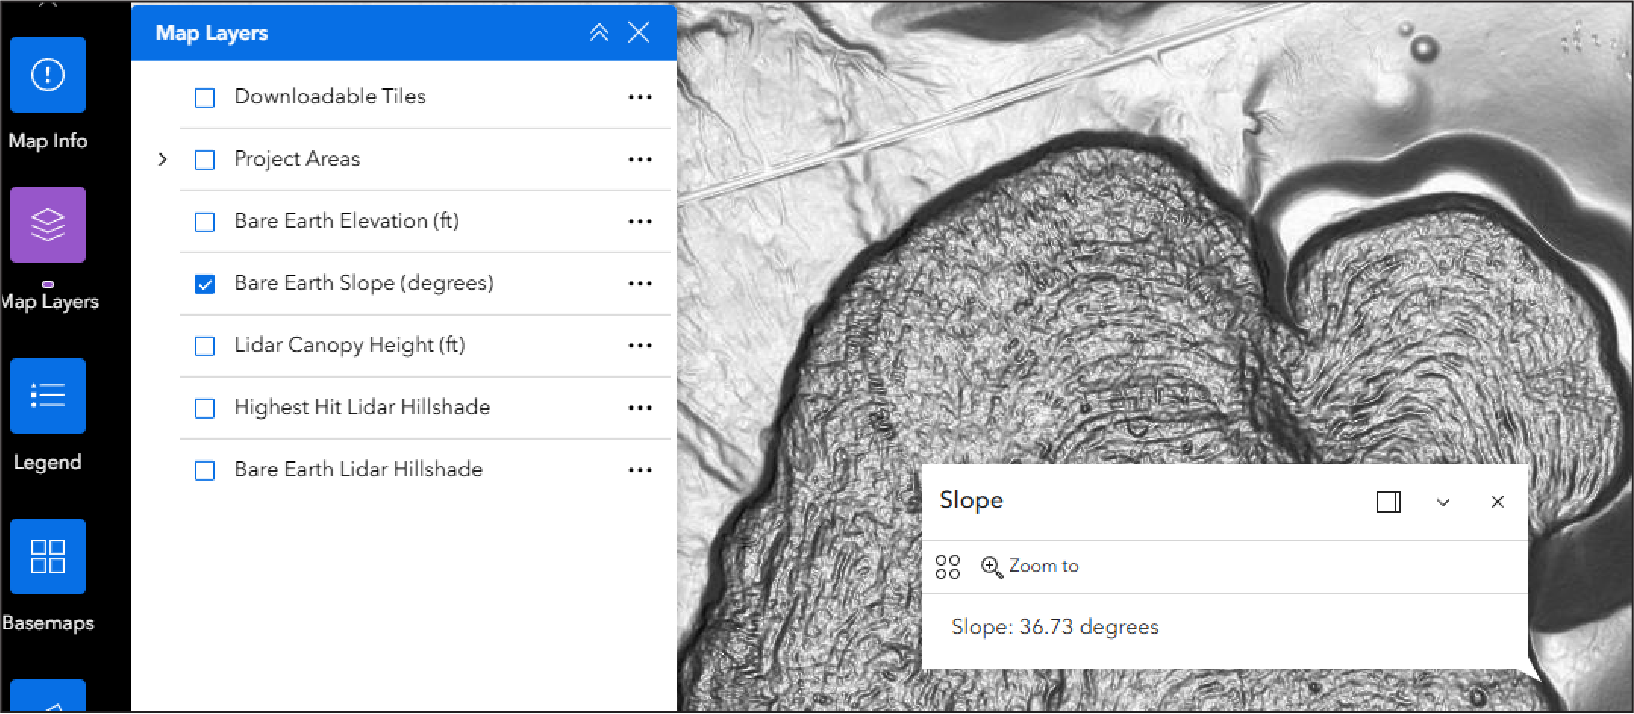 The Bare Earth Slope imagery shows the slope of the bare earth topography model. Clicking on specific points returns the slope value in degrees.
Slope Visualization
In the map viewer, slope is visualized as a white-to-black gradient. This gradient ranges from white, indicating low-angle slopes (i.e., flat, horizontal surfaces), to black, indicating high-angle slopes, such as cliff faces. The slope image shows the shape of the bare ground without being affected by the direction of lighting. It does not show the compass direction that the ground slopes toward.
Data Source
The Bare Earth Slope model is generated from the Bare-Earth Digital Terrain Model (see above for more information).
Lidar Canopy Height
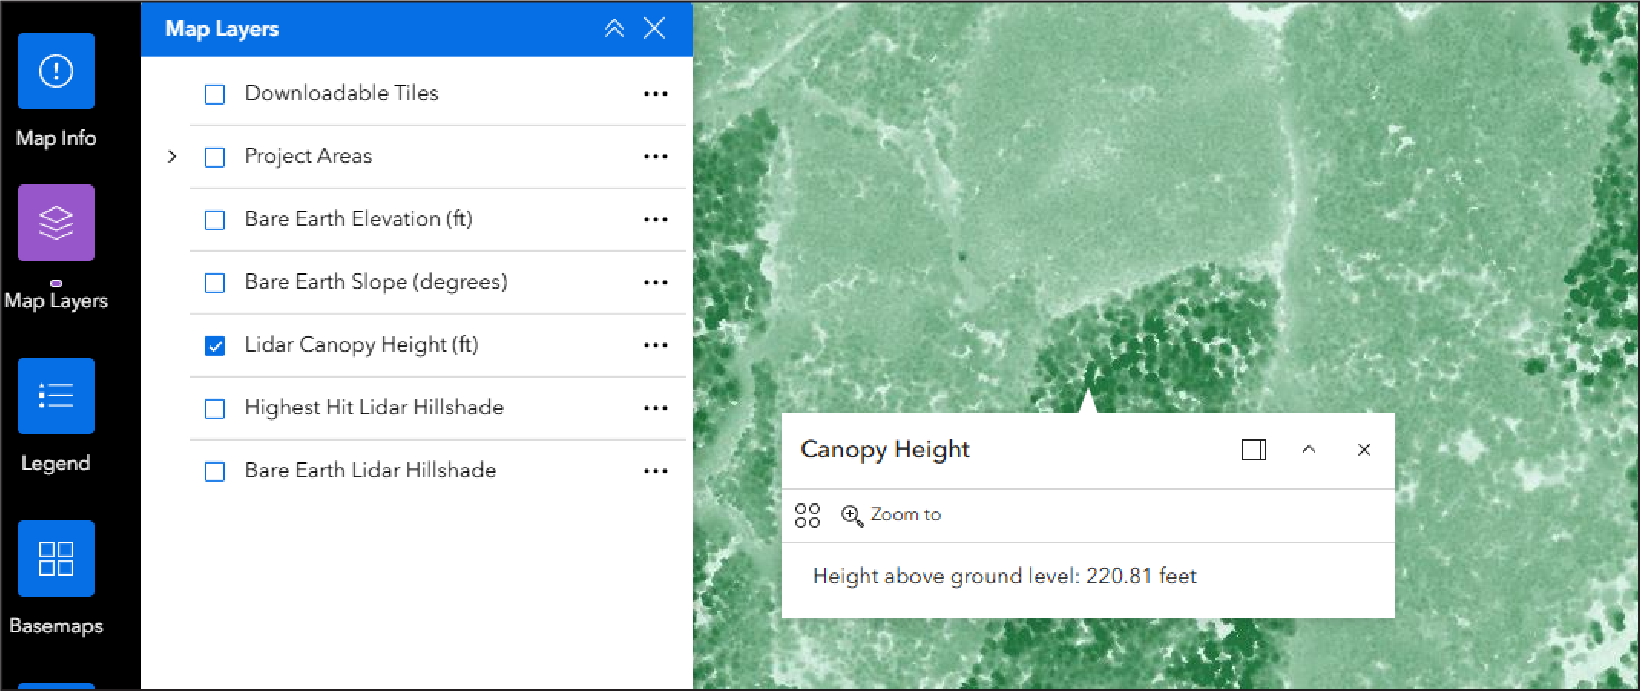
The Canopy Height layer shows a model of the distance in feet between the tops of objects such as trees or buildings and the ground surface, as determined from the most recent project at the click location. To see the canopy height in feet, click on a point.
Tip: Viewing a partially transparent Canopy Height model over the Highest-Hit Lidar Hillshade (below) is an effective way to visualize the dataset.
Note: The Highest Hit layer is less complete and updated than the Bare Earth layer currently, so in some locations of significant surface change, the Canopy Height model may contain discrepancies.
Canopy Height Visualization
The color scale in the Lidar Viewer varies over a range of 0–200 feet, to emphasize common values across the state. Darker shades indicate higher canopy heights, while lighter shades indicate lower canopy heights.
Data Source
To create the Canopy Height model, the Bare Earth layer was subtracted from the Highest Hit Lidar Hillshade layer (see below).
Limitations
In areas of steeply sloping topography and non-vertical leaning trees, the Canopy Height measurements are less accurate, but the simple difference gives a general indication of vegetation heights at the time of lidar collection.
Highest Hit Lidar Hillshade
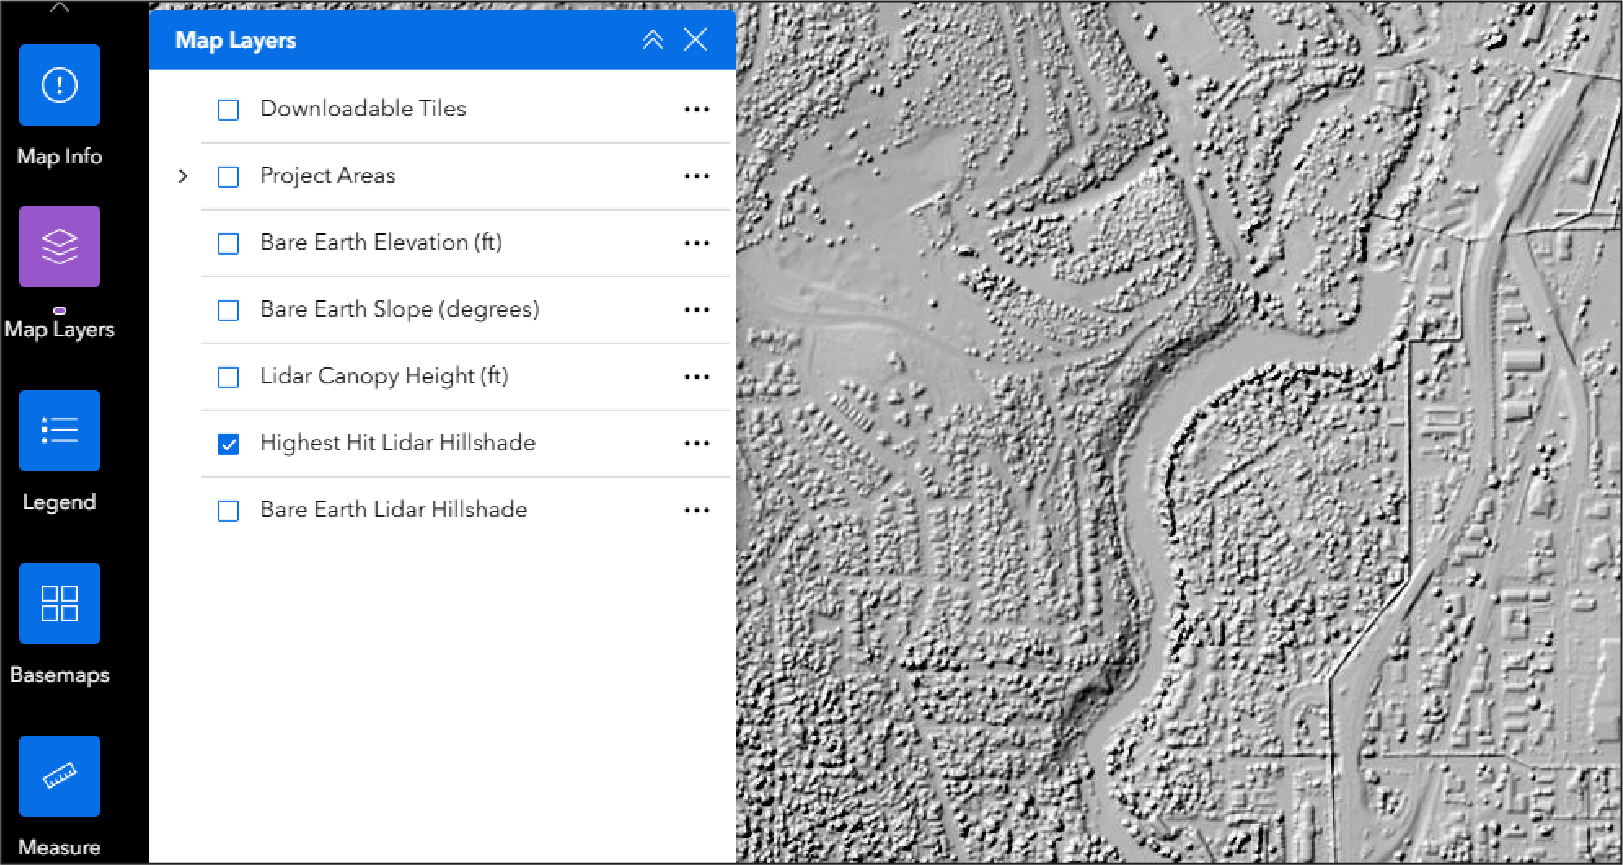
The Highest Hit Lidar Hillshade layer represents the uppermost portion of the natural and human-built landscape. Ongoing work at the Oregon Lidar Consortium will update the Highest-Hit Model across Oregon.
Highest Hit Visualization
The visualization of the Highest Hit Lidar Hillshade layer uses a hillshade method to mimic how the earth’s surface would look from an airplane. The grayscale hillshade image is generated with a simulated sun angle from the northwest to show the details of the landscape.
Data Source
The Highest Hit Lidar Hillshade layer derives from a digital surface model (DSM). The DSM is made from individual lidar points that represent the highest surface in each 3-foot-square grid cell.The DSM includes buildings, trees, and other vegetation.
Bare Earth Lidar Hillshade
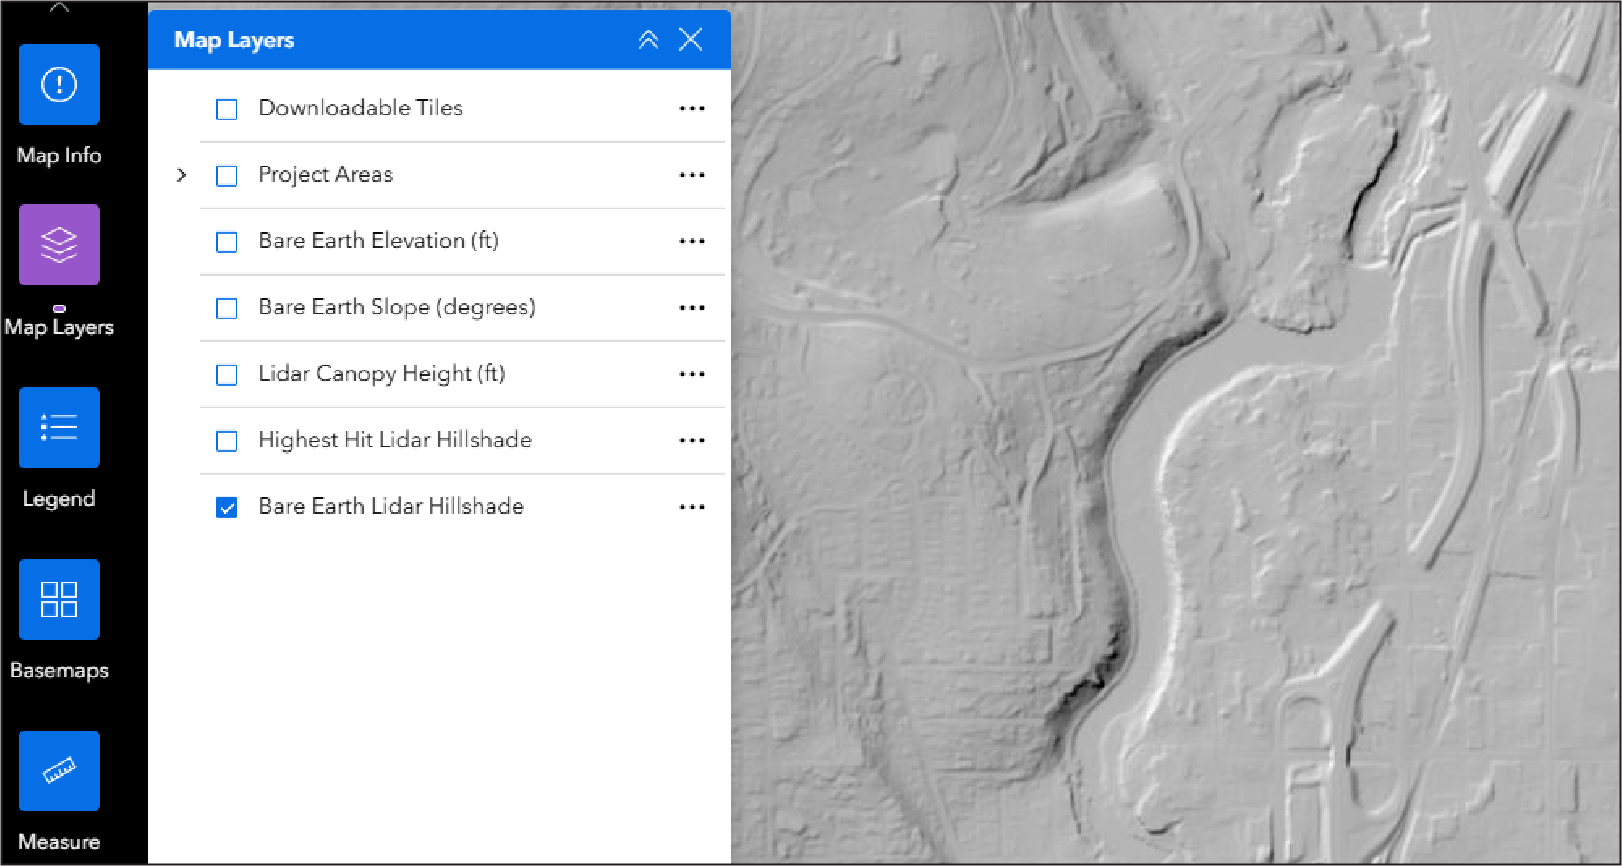 The Bare Earth Lidar Hillshade shows the form of the bare ground surface after stripping away the human-built structures and vegetation. Clicking in the map area returns the elevation at that point from the Bare Earth Digital Terrain Model. Comparison of the Bare-Earth Hillshade (above) and Highest-Hit Hillshade images from Bend, Oregon (in 2011) in the examples here show the differences between the two lidar models. In some location, "facets" in the bare-earth data are visible; these correspond either to water or to areas of dense vegetation or buildings.
Bare Earth Visualization
The visualization of the Bare Earth Lidar Hillshade layer uses a hillshade method to mimic how the earth’s surface would look like from an airplane if all the vegetation and human-built structures were stripped away. The grayscale image mimics what might be seen from above with the sun illuminating the topography from the northwest.
Data Source
The Bare Earth Lidar Hillshade layer is derived from the same digital terrain model as the Bare Earth Elevation layer.