DOGAMI SPECIAL PAPER SERIES
Publication Preview
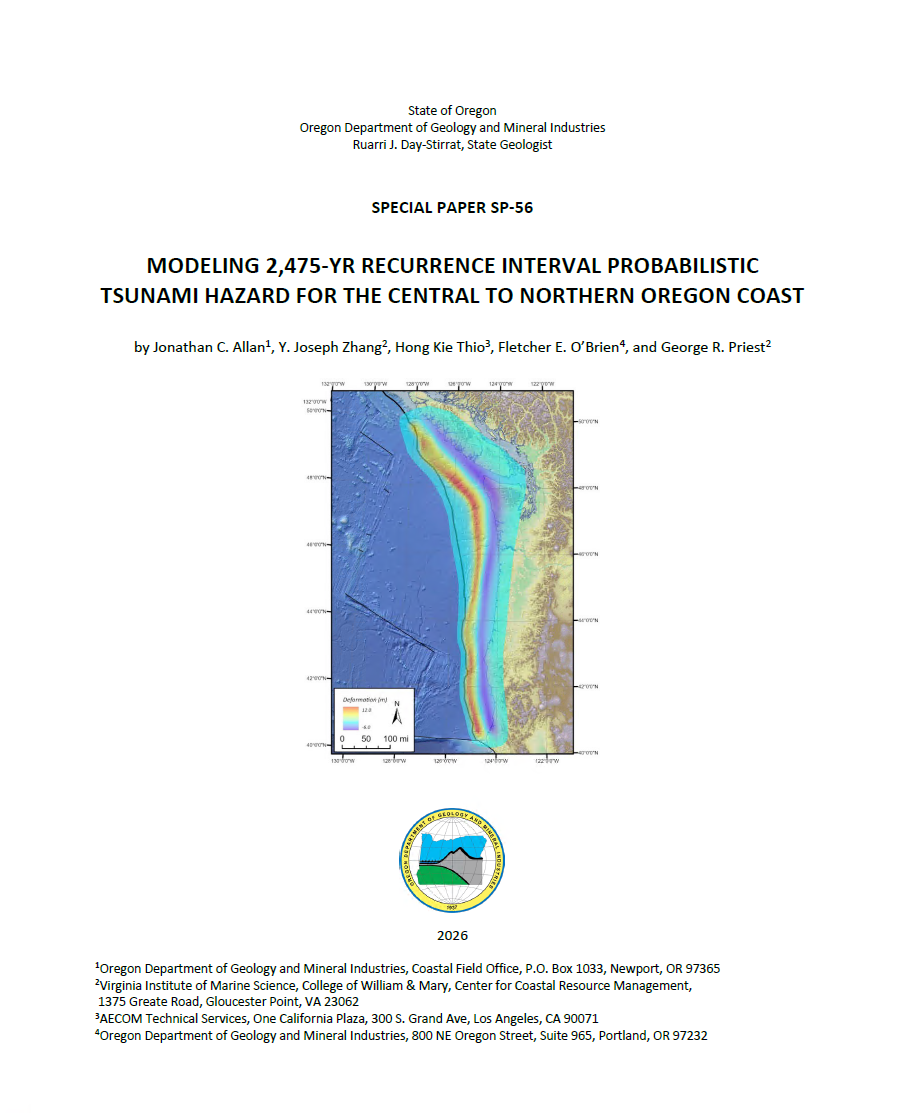
Special Paper 56, Modeling 2,475-Year Recurrence Interval Probabilistic Tsunami Hazard for the Central to Northern Oregon Coast, by Jonathan C. Allan, Y. Joseph Zhang, Hong Kie Thio, Fletcher E. O’Brien, and George R. Priest.
WHAT’S IN THIS REPORT?
The objective of this study has been to produce updated 2,475-yr average return period (ARP) probabilistic tsunami hazard analysis (PTHA) maps for the central to northern Oregon Coast, including Clatsop County, Tillamook County, and Lincoln County. The new maps incorporate improved Cascadia earthquake rupture models developed in the past five years, improved bathymetric and topographic digital elevation models produced by NOAA's National Center for Environmental Information (NCEI), and high-resolution tsunami inundation modeling.
We modeled seven disaggregated Cascadia Subduction Zone (CSZ) deformation models that were scaled to meet the minimum requirements of a 2,475-yr earthquake rupture. Calculated earthquake moment magnitudes (MW) ranged from 9.02–9.22, with maximum slip offshore of the northern Oregon Coast ranging from 38–42 m. The rupture scenarios evaluated in this study included:
- A full-margin deep rupture with a downdip limit constrained to the 1 cm/yr locking contour
- Two different full-margin shallow buried ruptures with downdip extents located halfway between the fully locked zone from thermal modeling and the 1 cm/yr locking contour
- A full-margin 100% trench breaching rupture with a downdip extent constrained to the 1 cm/yr locking contour
- A full-margin splay fault rupture with a downdip extent constrained to the 1 cm/yr locking contour
- A segment C deep buried rupture with a downdip extent constrained to the 1 cm/yr locking contour
In total, some 26 tsunami simulations were performed, including a reevaluation of rupture scenarios (XL2 shallow buried and XL3 deep buried rupture models) originally produced by DOGAMI between 2010 and 2013. From the simulated results, the authors produced new GIS data showing tsunami inundation zones for a 2,475-yr ARP tsunami that span multiple scenarios, rasters that depict the simulated flow depths and maximum water levels as well as rasters of tsunami-generated currents and momentum flux, and other derivative products. Combined, these data are intended for use and adoption by the ASCE Tsunami Loads Committee to replace the existing ASCE7-22 Tsunami Design Zone (TDZ) and geodatabases produced for Oregon in 2016. With the modeling now complete, the timeline for adoption of the new maps by the full ASCE committee is 2028. Once adopted, the new 2,475-yr ARP tsunami hazard maps and geodatabase will automatically become part of the Oregon Building Codes 2019 Oregon Structural Specialty Code (OSSC) and will be accessible through the ASCE tsunami hazard tool.
PUBLICATION DOWNLOADS
LOCATION MAP
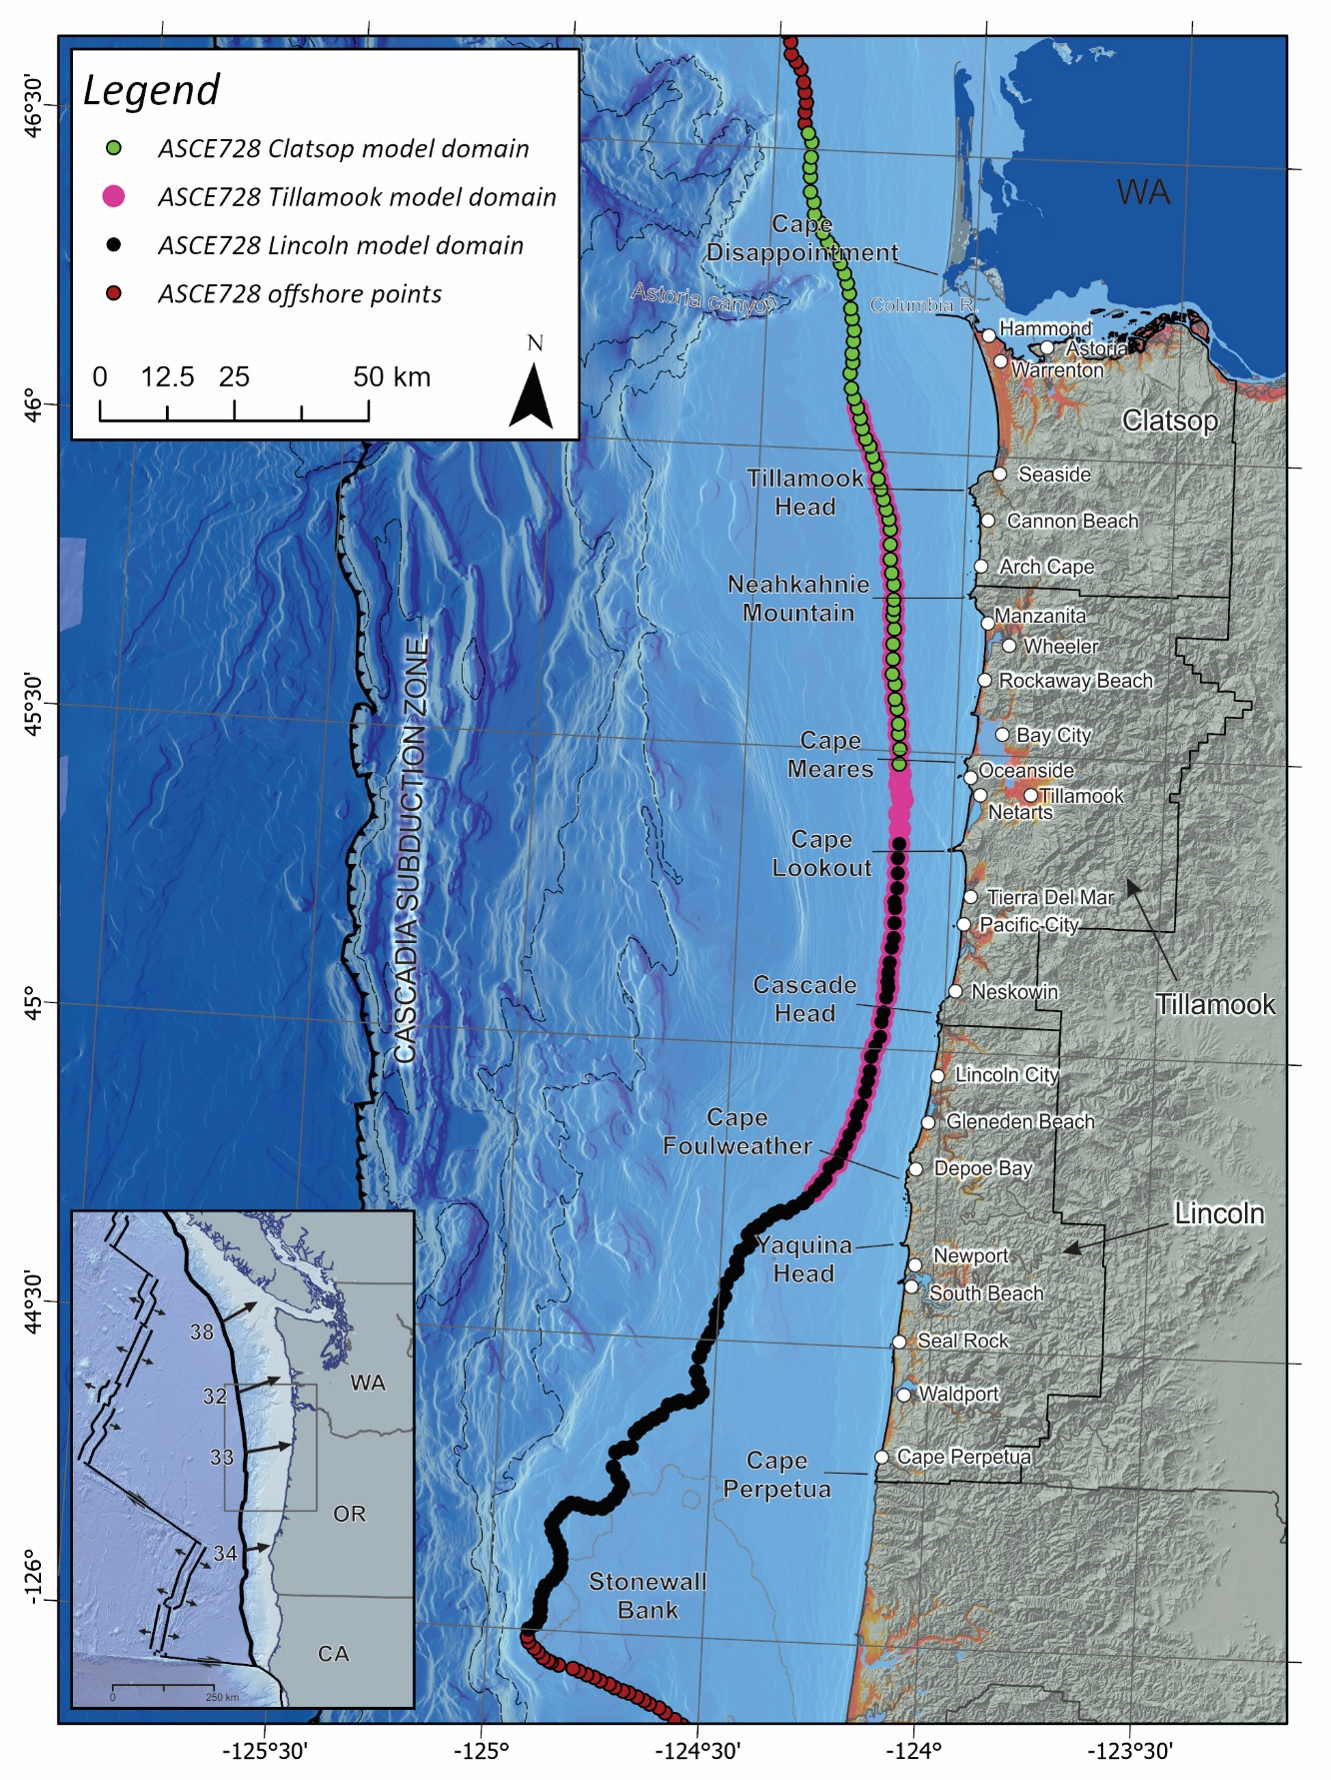
Figure 1-1. Location map of the central to northern Oregon Coast showing key place names and offshore point locations (colored circles) used to define probabilistic tsunami hazard curves. Green and black circles with pink borders highlight those points that overlap across model domains. Inset map depicts plate convergence rates (mm/year).
Logic Tree PDFs
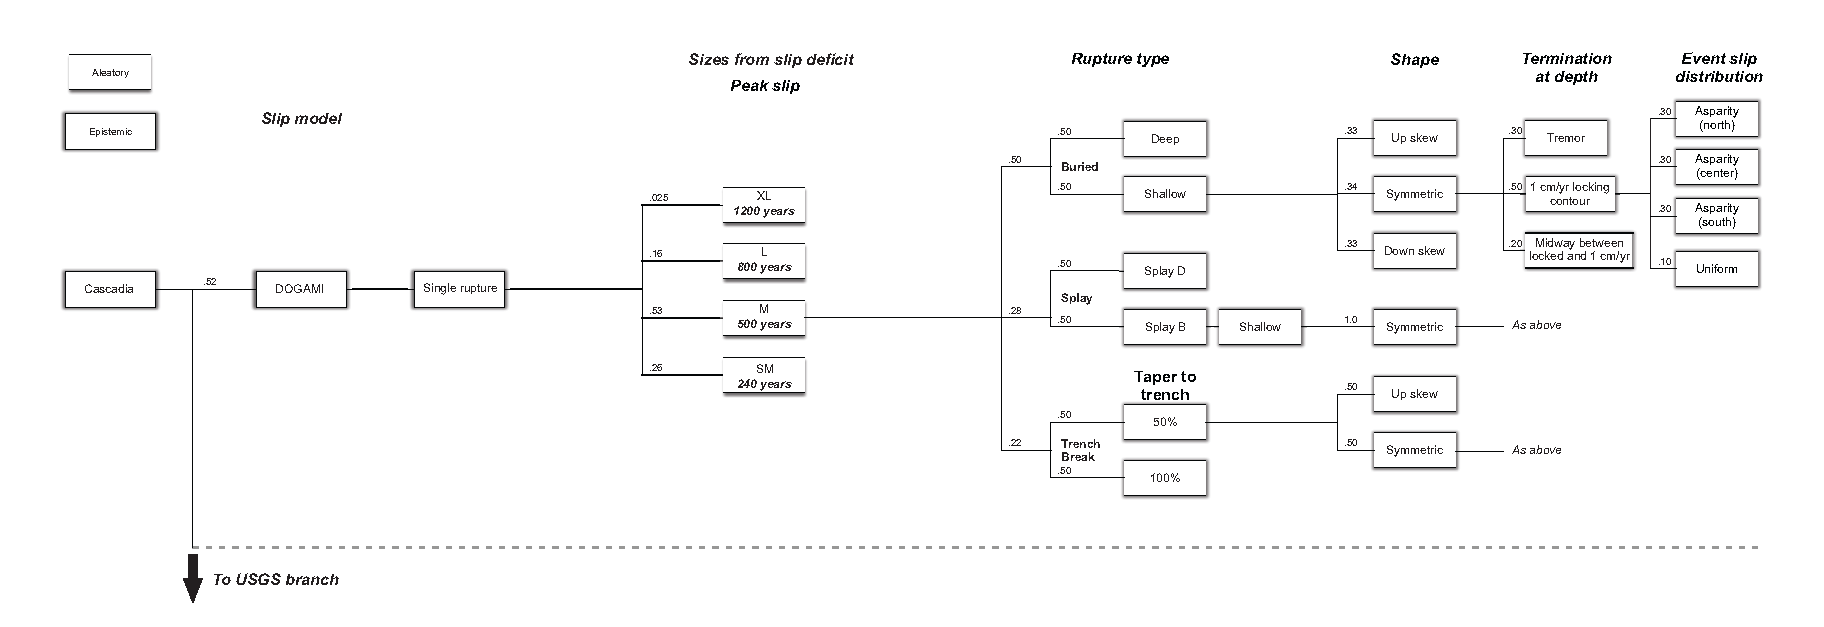
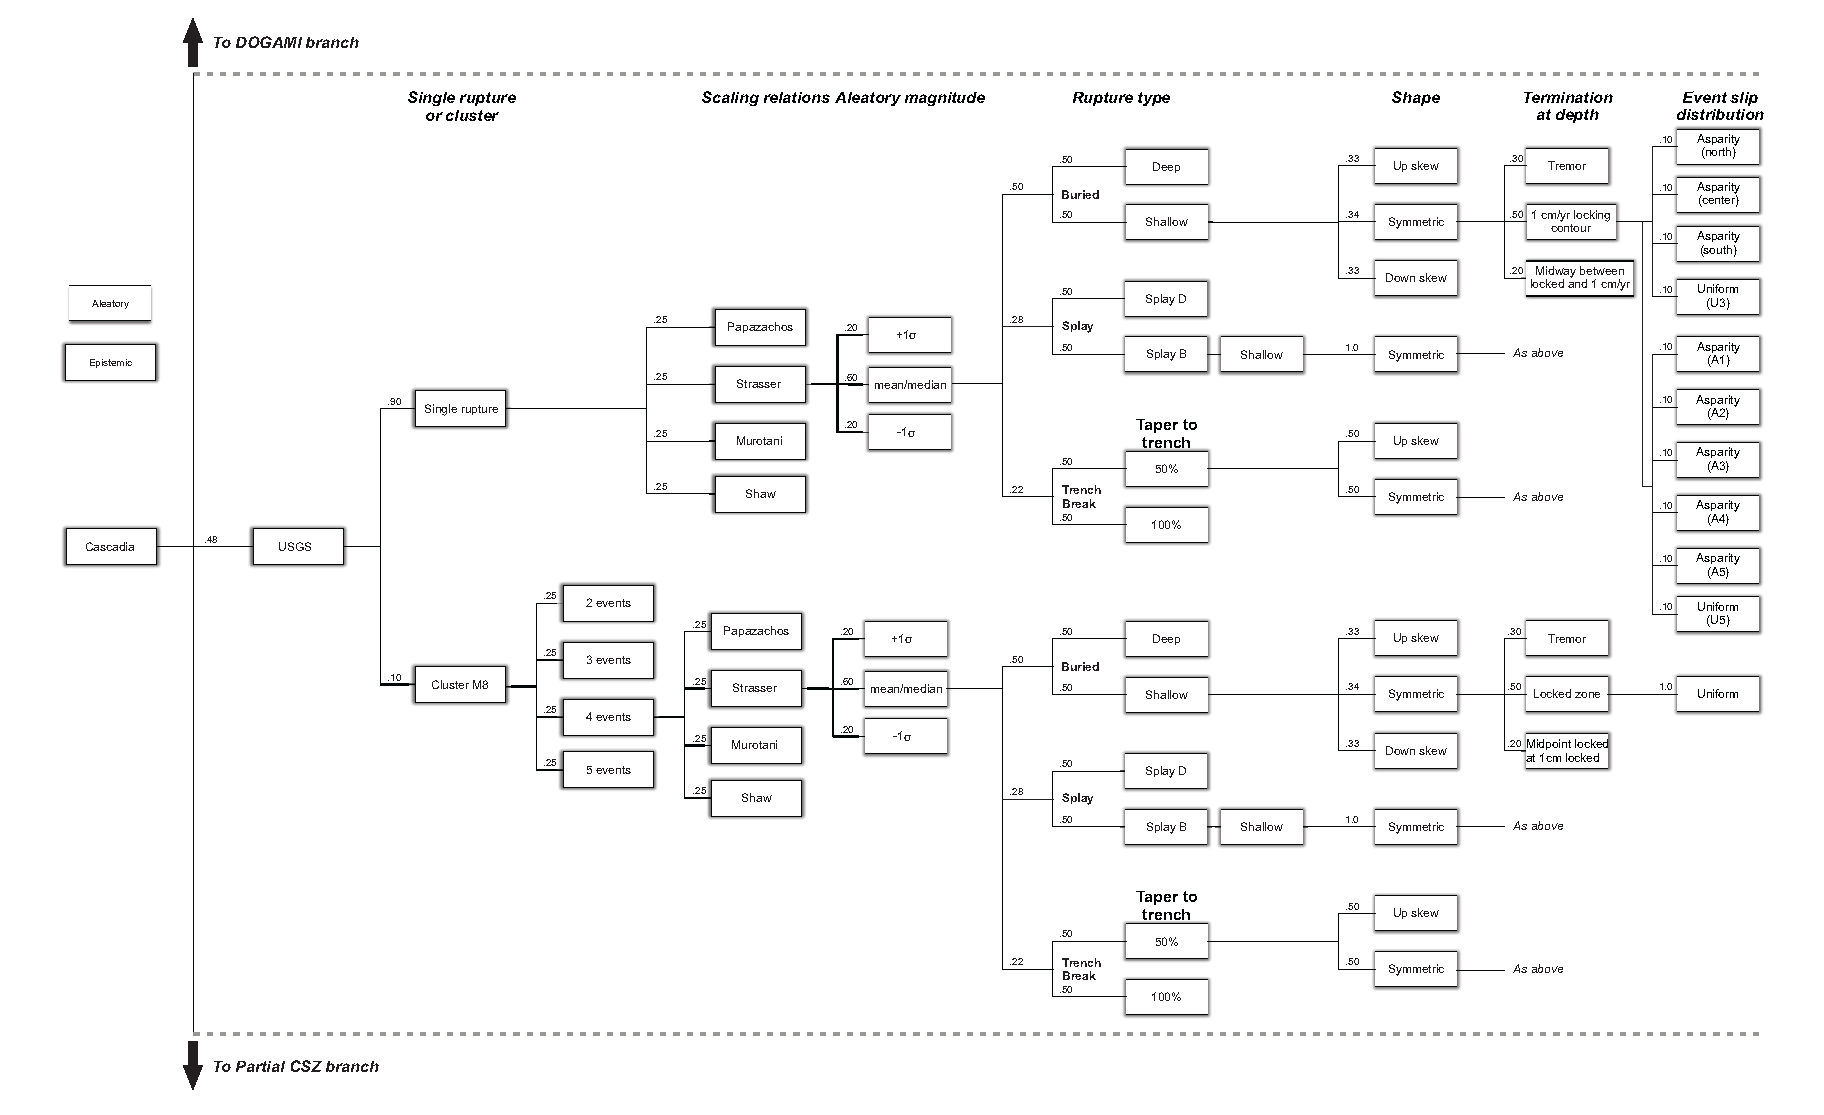
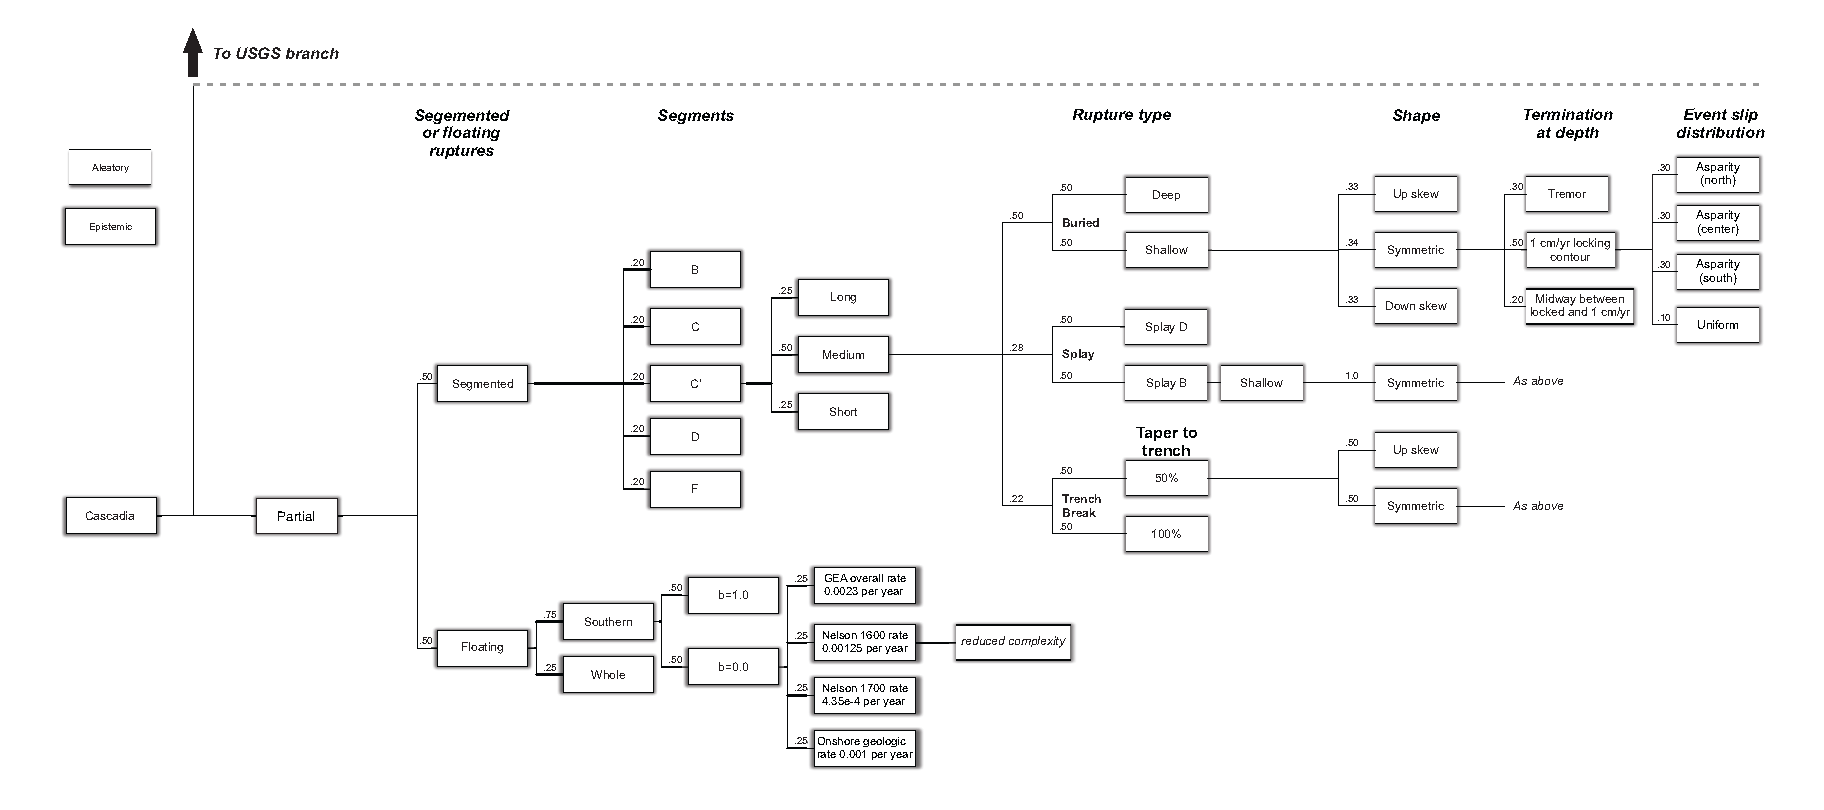
Figure 1-2. Updated Cascadia Subduction Zone logic tree (as modified from Sypus and Wang, 2024; Figure 1-2 in report). To access a PDF version of each of the figure components, click on the images below.