
Oregon State Flag An official website of the State of Oregon »

Oregon Health Authority logo

Oregon Death Data

Updated June 1, 2026

Oregon State law requires a record be completed for all deaths. These records are the primary data source for the health information presented here.

Preliminary Death Data

Preliminary data are undergoing quality assurance and editing procedures that can result in frequent and significant changes. Please use caution when interpreting these data.
Data can be used for tracking recent health events, but are not appropriate for use in statistical analyses. Final death data is shown in the next section below.

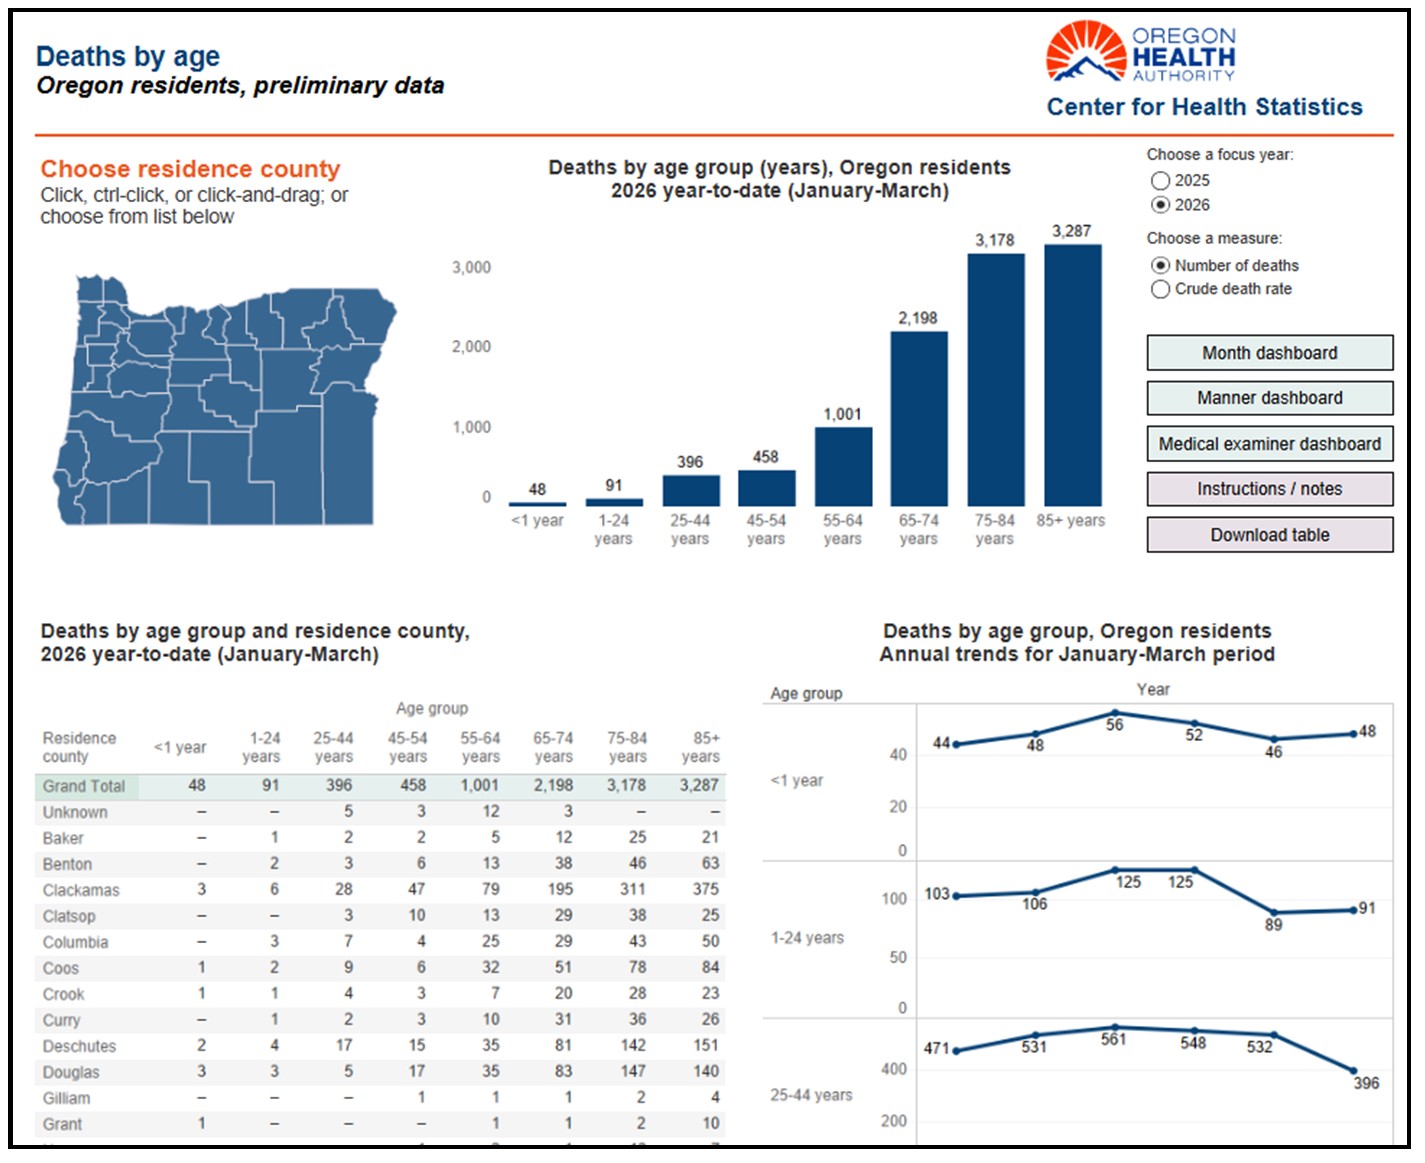
Preliminary Death Data (2025-2026)

Data goes through a quality assurance check and may experience lag for the preliminary dash data.
  • Number of deaths
  • Preliminary death rate
  • Manner of death
  • Month of death
  • Age of decedent
  • County of residence
  • Historical trends


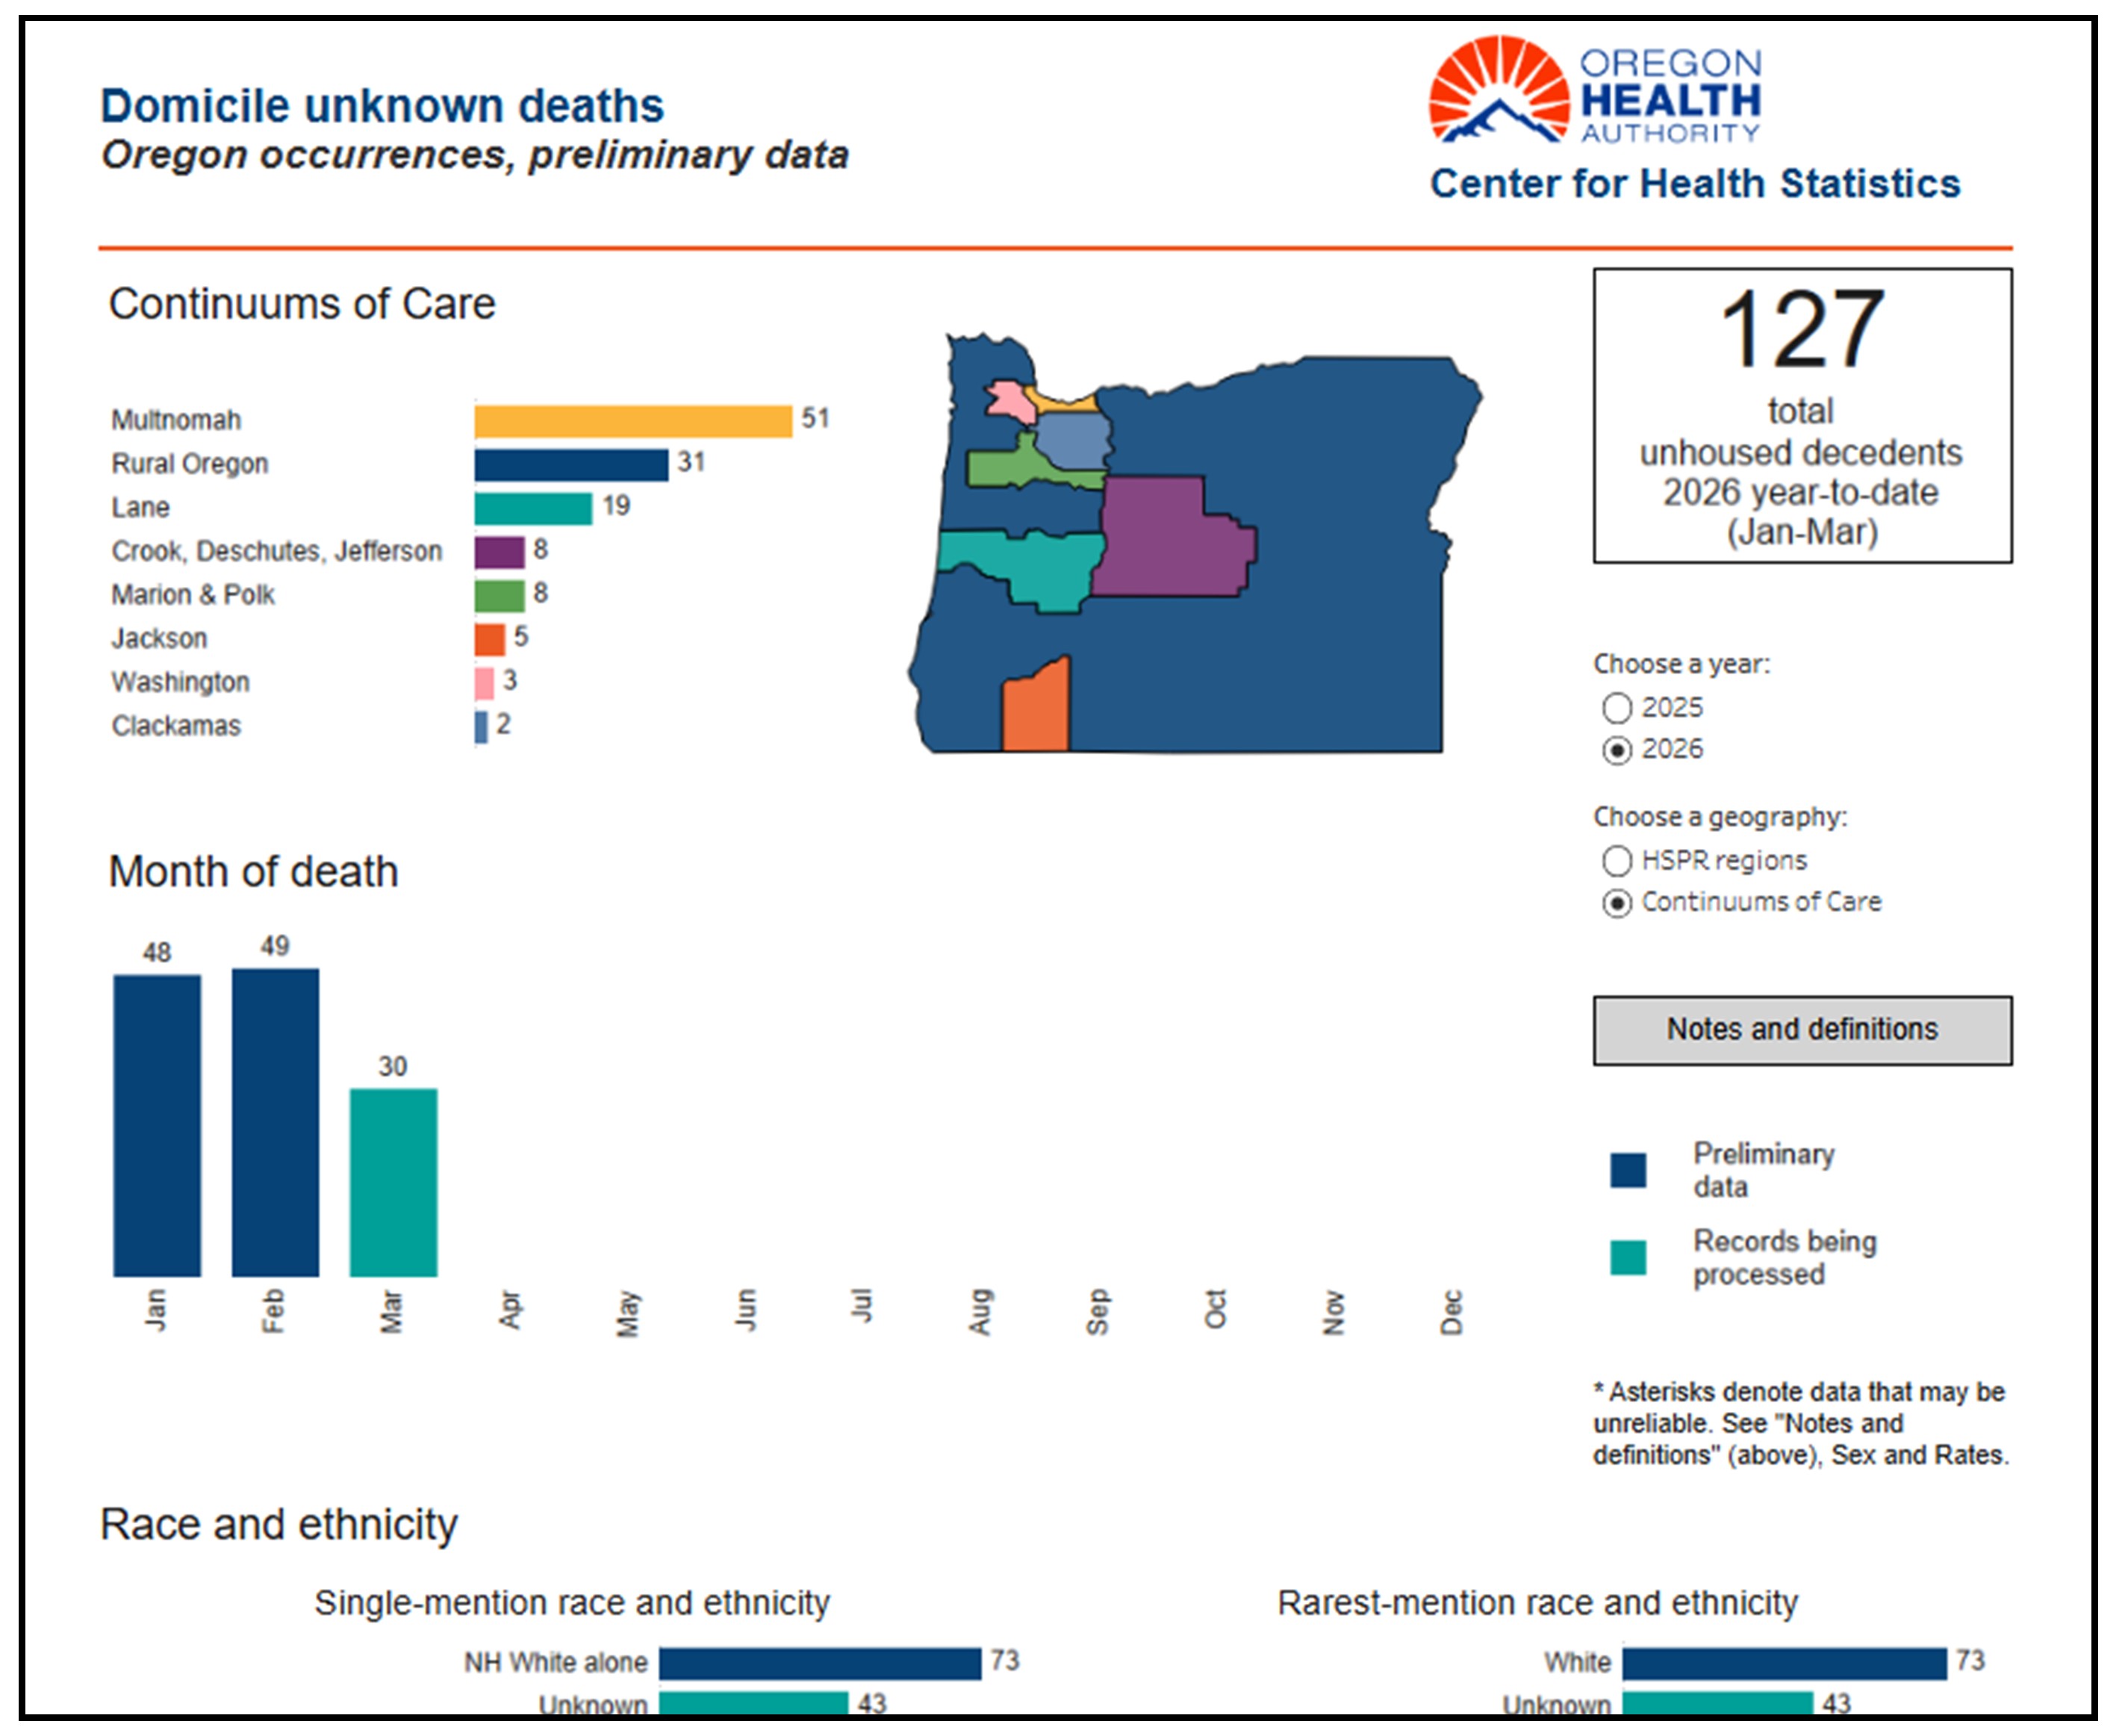
Preliminary Domicile Unknown (2025-2026)
  • Number of deaths
  • Manner of death
  • Month of death
  • Sex, age, race/ethnicity
  • Place of death
  • Continuum of care (geography)
  • HSPR region (geography)


Final Death Data and Fast Stats 

These data dashboards represent final statistics on deaths in Oregon. Final data has undergone extensive quality assurance and editing procedures and may experience lag for preliminary dash data. New data are added each year in late fall.


Annual Trends Dashboard
Topics include:
  • Crude death rates
  • Age-adjusted death rates
  • Leading causes of death
  • Sex
  • Age
  • Years 2010-2024


Leading Cause of Death Dashboard
Topics include:
  • Number of deaths
  • Crude death rates
  • Median age
  • Years of potential life lost
  • Leading causes of death
  • Demographics
  • Month and place of death
  • Years 2017-2024


County Deaths Dashboard
Topics include:
  • Number of deaths
  • Crude death rates
  • Median age
  • Years of potential life lost
  • Leading causes of death
  • Demographics
  • County
  • Years 2017-2024


Injury Deaths Dashboard
Topics include:
  • Number of deaths
  • Crude death rates
  • Years of potential life lost
  • Manner of death
  • Type of injury
  • Demographics
  • County
  • Years 2017-2024


Domicile Unknown Dashboard
Topics include:
  • Number of deaths
  • Cause of death
  • Month of death
  • Demographics
  • Place of death
  • Continuum of care
  • Years 2022-2024 


Additional Death Data


These tables show three-year aggregates of Oregon resident deaths by age of decedent, county, and ZIP code. If ZIP codes are not from a particular county, those deaths should be considered unknown or missing for ZIP code information. This information is often used for population planning.

  • Data tables are being updated for digital accessibility. Please check back later.

​ 


In 2018, the U.S. Small-area Life Expectancy Estimates Project (USALEEP) produced a report and first-of-its-kind interactive map that showed life expectancy by census tract across the United States. Public health officials, community leaders, and others working to improve health can access census tract level data from 2010-2015 to measure and compare differences in life expectancy in nearly every neighborhood across the country.​


The data shows estimated life expectancy at birth for the period 2010-2015. Life expectancy at birth is the average number of years a newborn is expected to live if mortality rates at the time of birth remain the same. Census tracts include an average of 4,000 people who typically have similar characteristics, such as social and economic status.


USALEEP is a joint effort of the National Association for Public Health Statistics and Information Systems, the Centers for Disease Control and Prevention’s National Center for Health Statistics, and the Robert Wood Johnson Foundation. The report is based on state death records and population estimates from the U.S. Bureau of the Census.