
The Oregon Health Authority (OHA) is working with its partners the Oregon Department of Human Services, Morrow County Public Health Department, Umatilla County Health Department, and community based organizations to provide free safe water services to households impacted by high nitrate levels in northern Morrow and northwestern Umatilla counties. This is the area known as the Lower Umatilla Basin Groundwater Management Area (LUBGWMA). Nitrate levels at or over
10 milligrams per liter (mg/L) can cause
serious health issues, especially for pregnant people and babies. What is on this page?
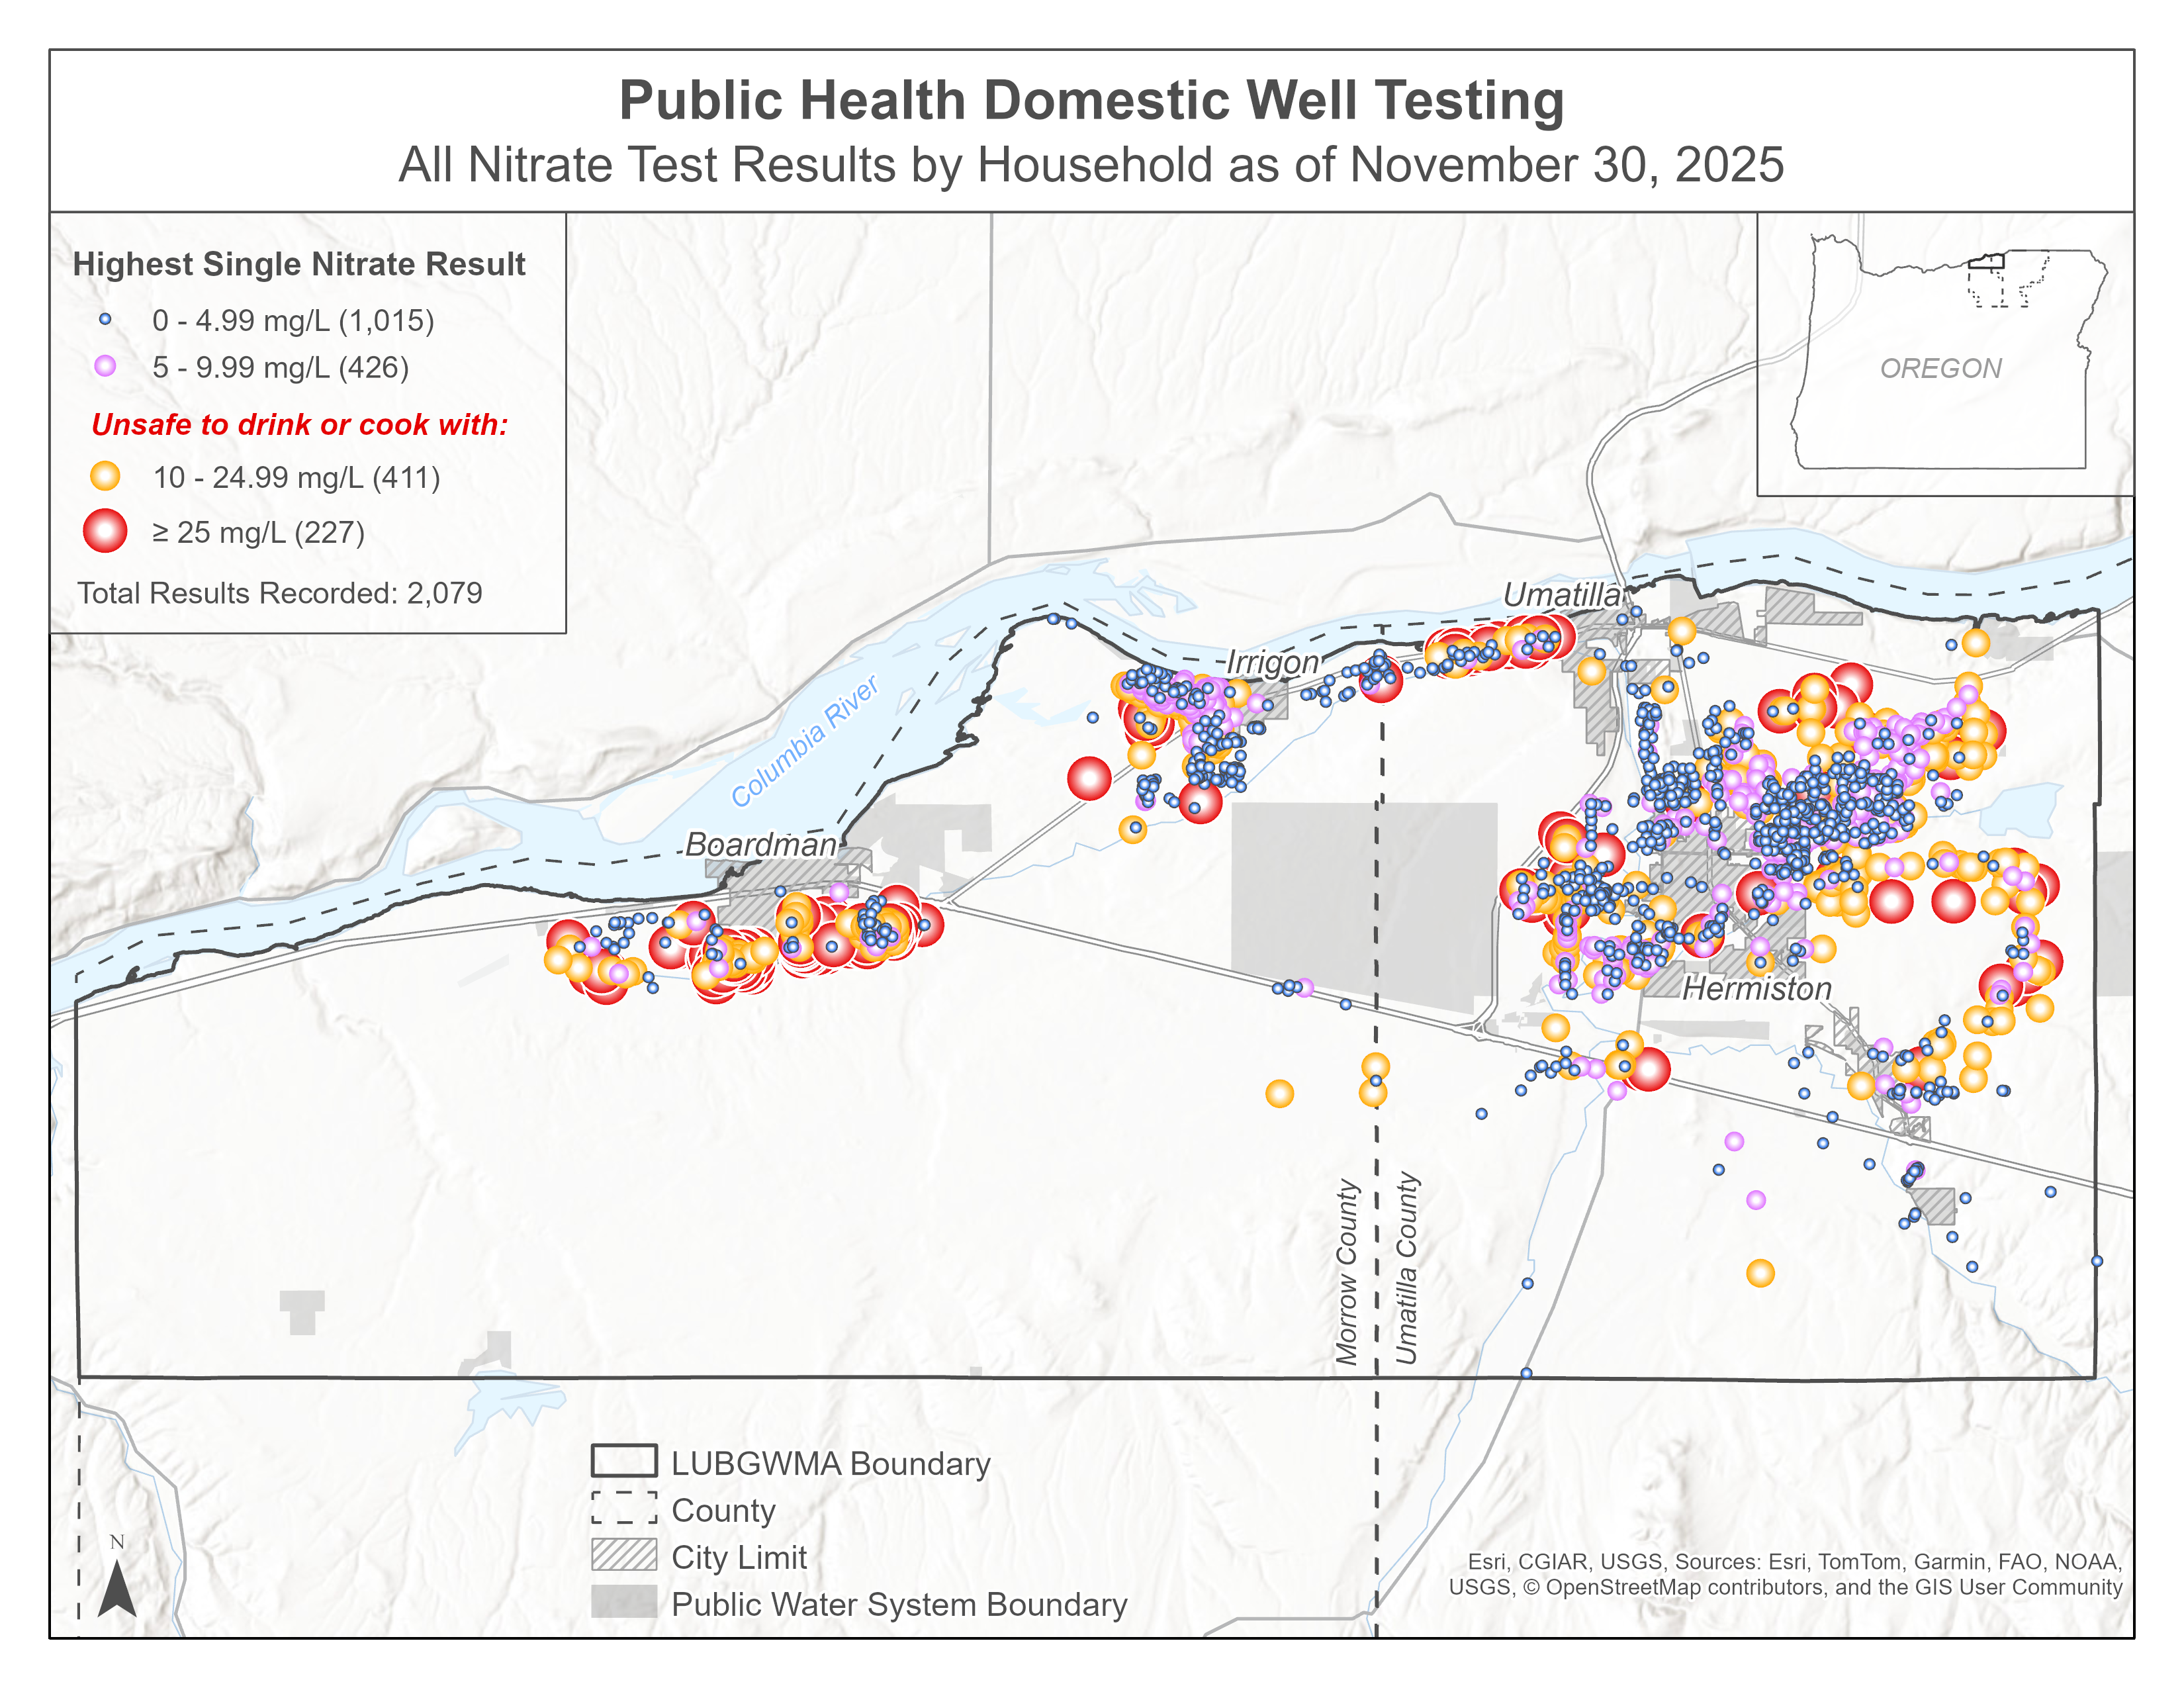
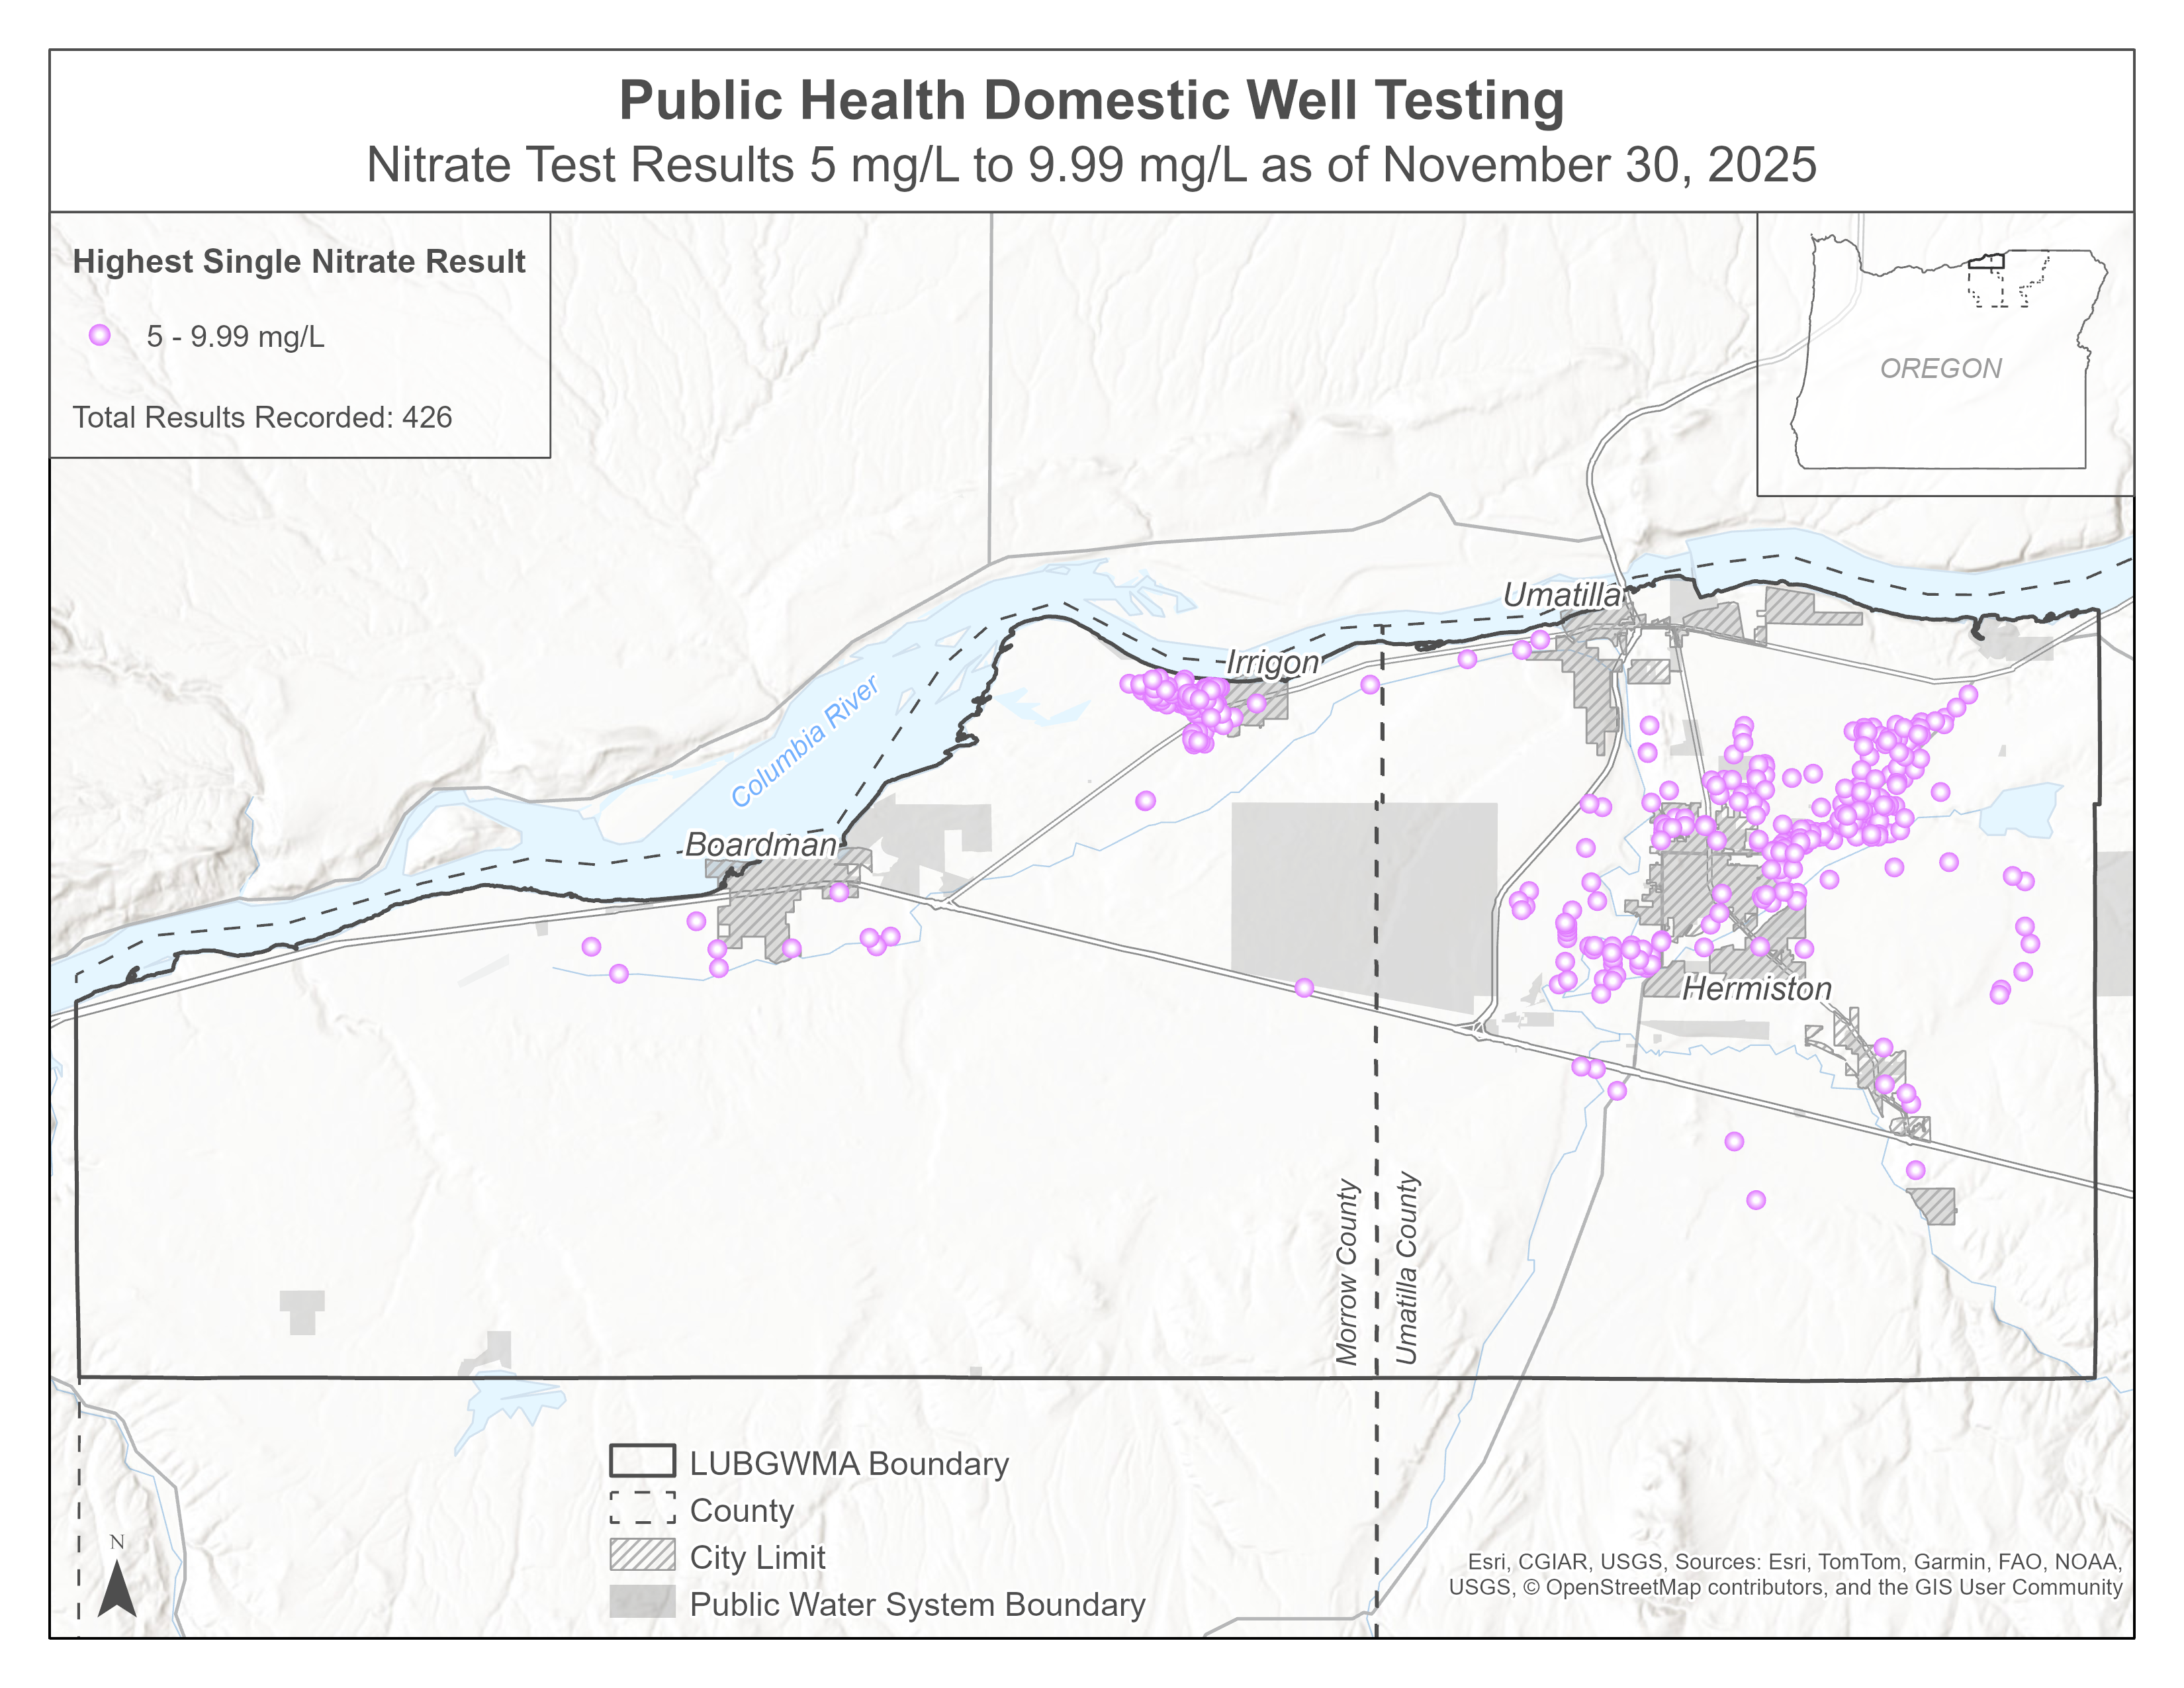
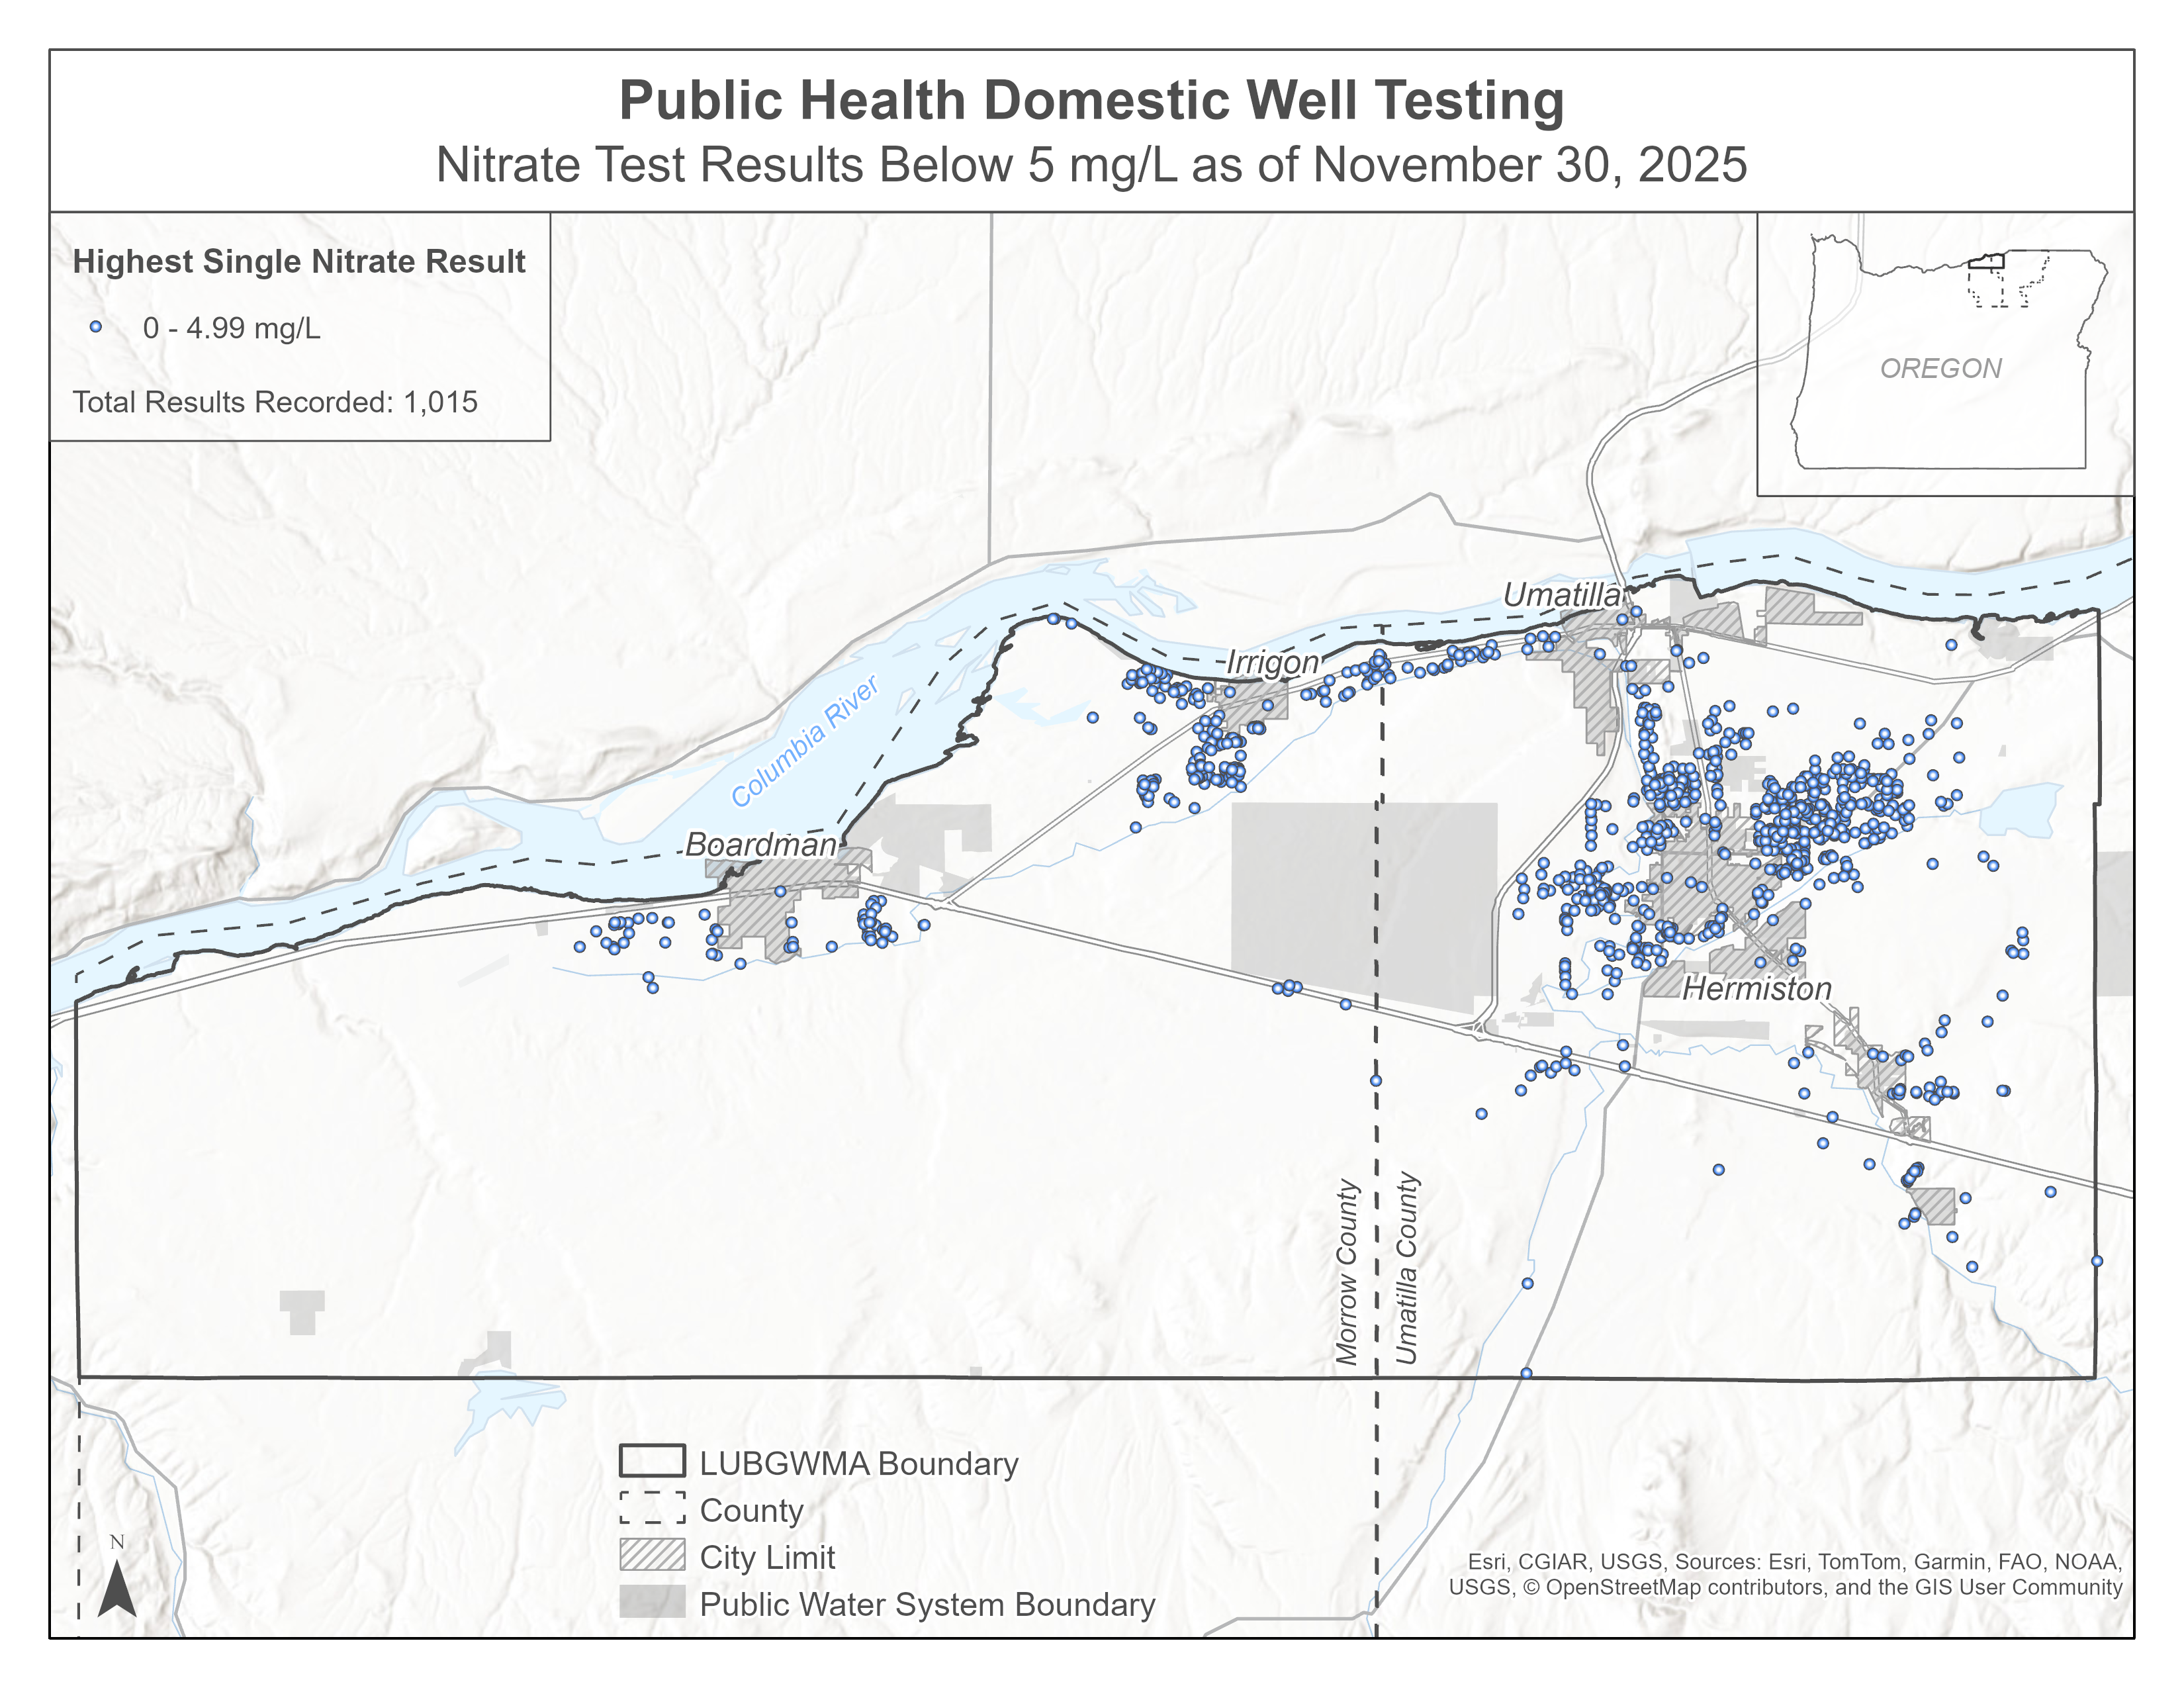
The maps below show the results of laboratory tests for nitrate in well water. The tables lower on the page provide the same information by the numbers, along with tables listing the number of households that have had water treatment systems installed, and households receiving bottled water deliveries. This page is updated on the 15th of the month.
For more information about the data that OHA is collecting related to domestic well testing in the Lower Umatilla Basin, please read this
memo from Gabriela Goldfarb, OHA’s Environmental Public Health Section Manager.
All nitrate test results
Nitrate test results
at or above 10 mg/L (high levels) 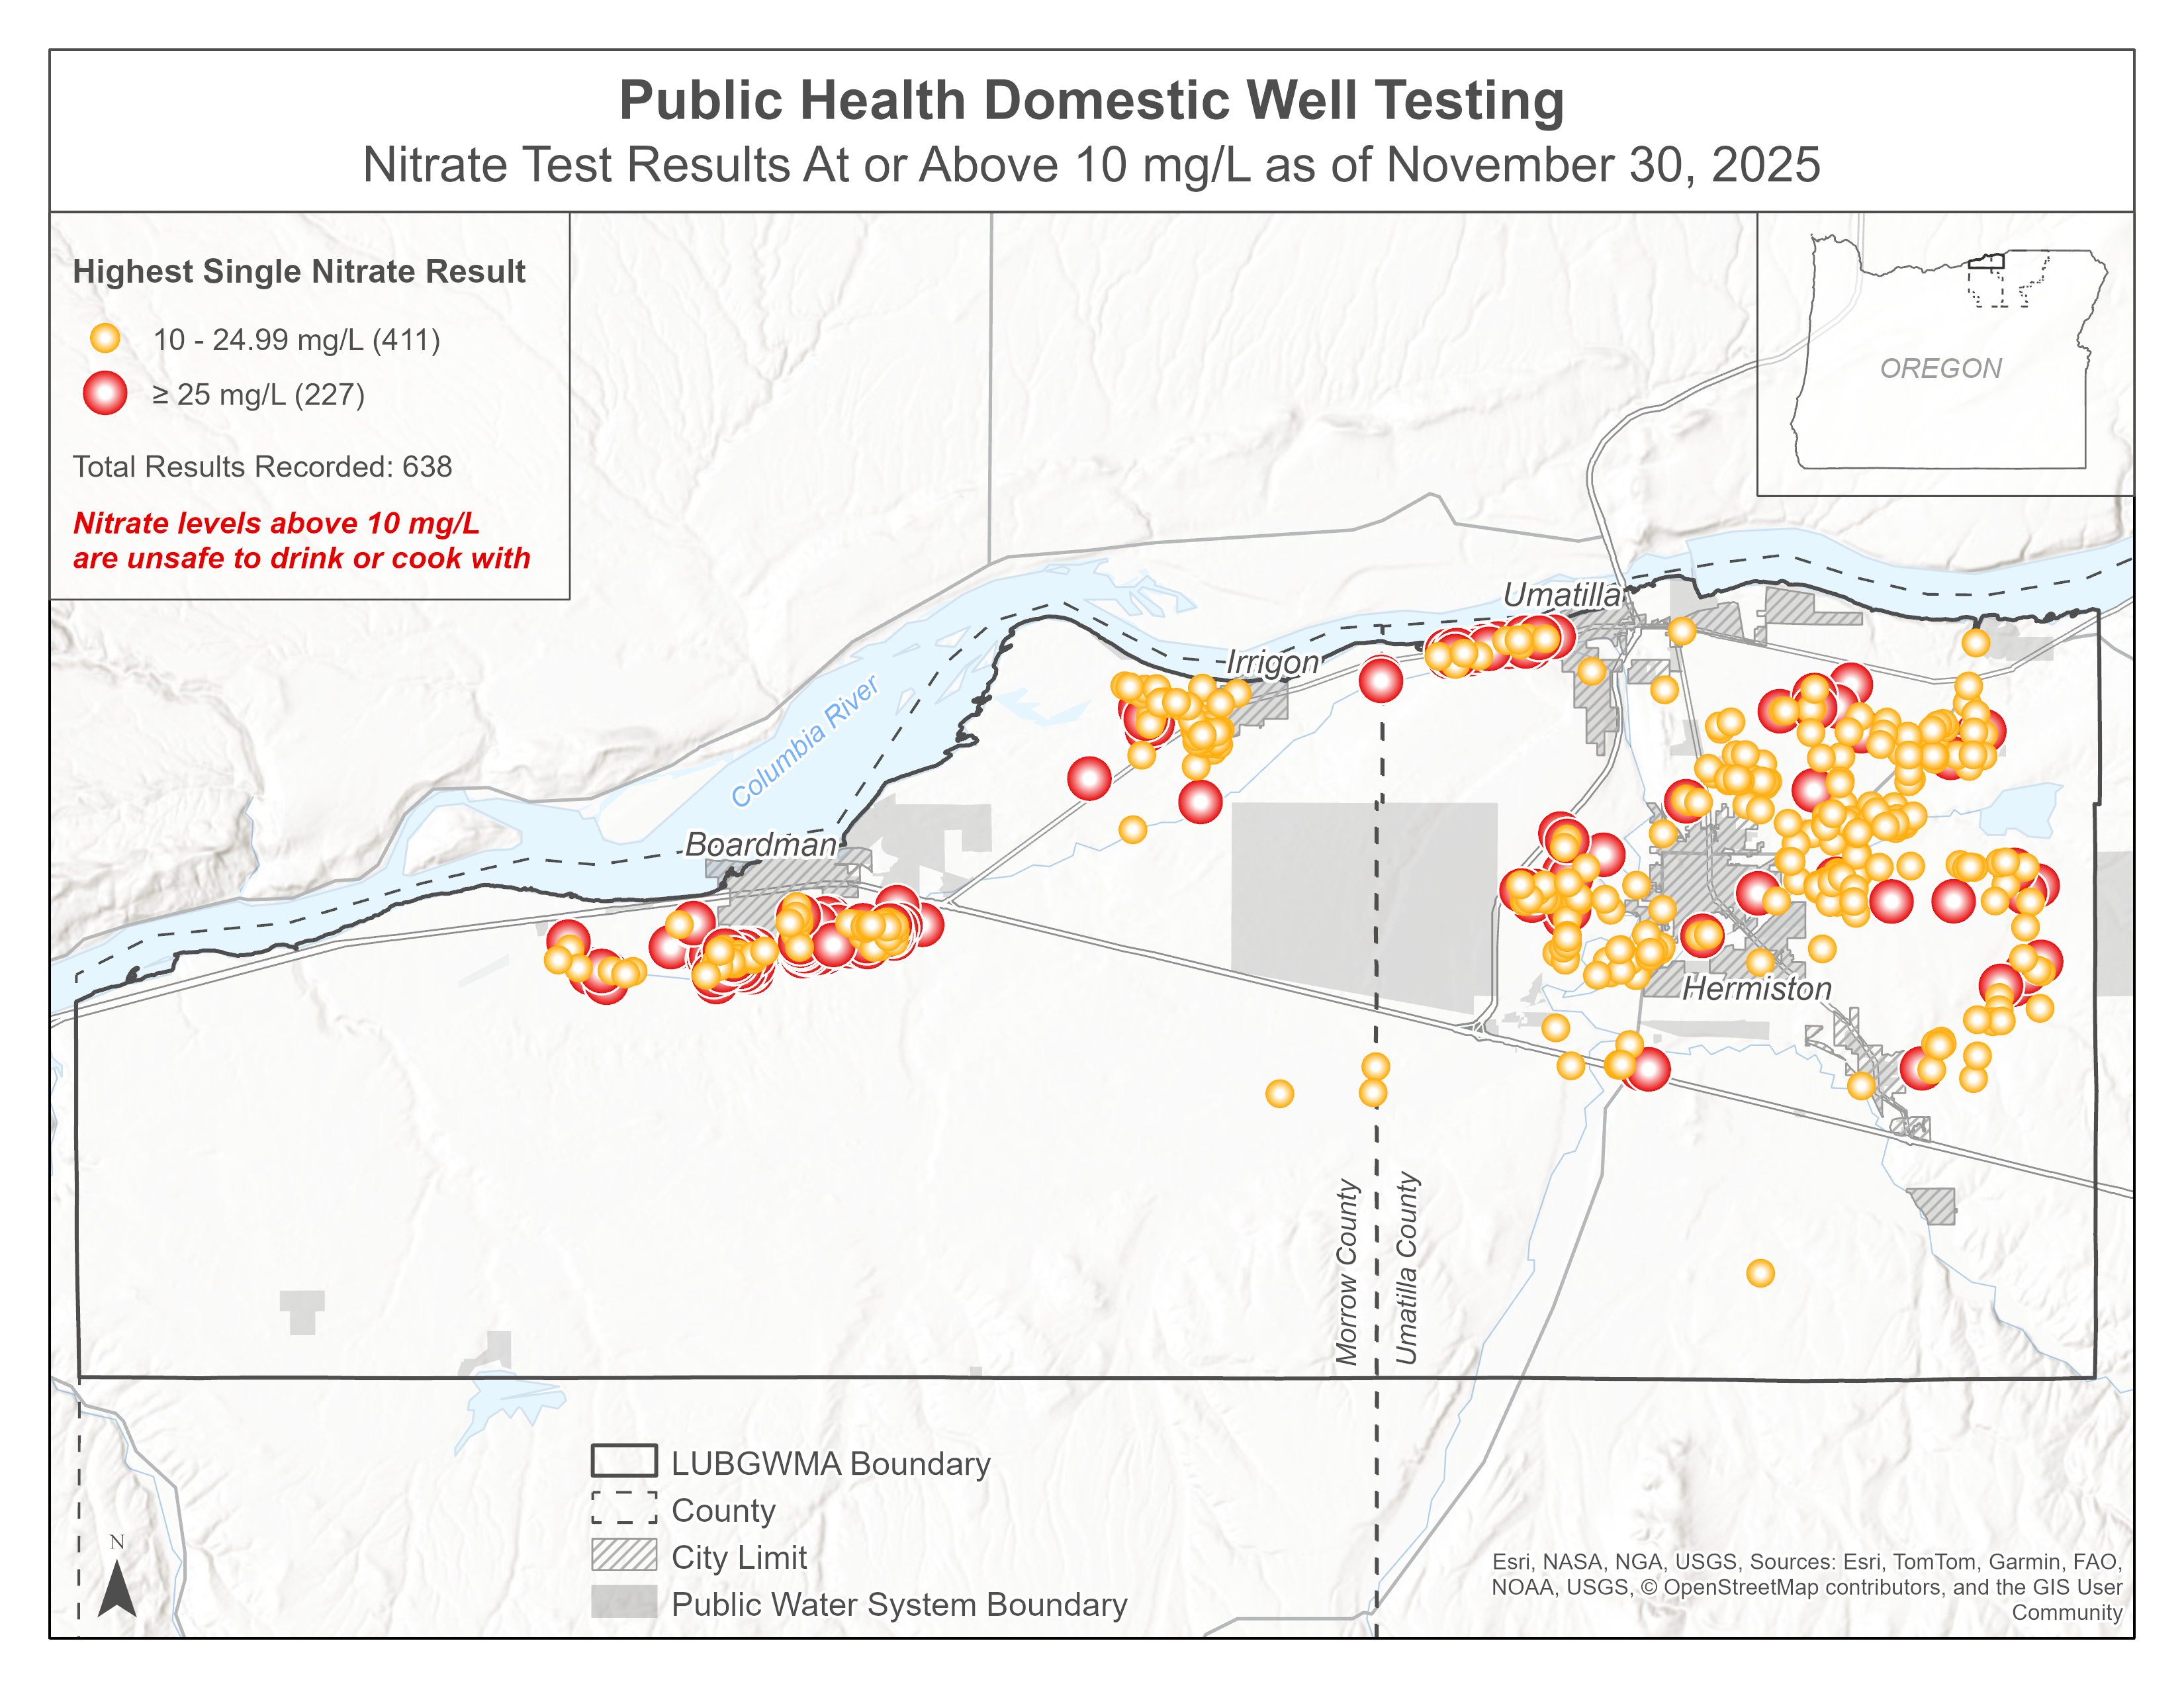
Nitrate test results 5 mg/L to 9.99 mg/L
Nitrate test results below 5 mg/L
Summary Tables
as of May 31, 2026
Household Nitrate Test Results
| Nitrate Range | Morrow | Umatilla | Total |
|---|
0 to 4.99 mg/L
| 250
| 797
| 1047
|
|---|
5 to 9.99 mg/L
| 127
| 307
| 434
|
|---|
10 to 24.99 mg/L
| 159
| 288
| 447
|
|---|
At or above 25 mg/L
| 157
| 84
| 241
|
|---|
| TOTALS | 693
| 1476
| 2169
|
|---|
Households with Nitrate Test Results At or Above 10 mg/L
| Nitrate Range | Morrow | Umatilla | Total |
|---|
| 10 to 24.99 mg/L | 159
| 288
| 447
|
|---|
| At or above 25 mg/L | 157
| 84
| 241
|
|---|
| TOTALS | 316
| 372
| 688
|
|---|
| Total high results as percent of all samples | 46% | 25% | 32%
|
|---|
Water Treatment System Installations
____________________________________________________________________________________________________
| Morrow | Umatilla | Total |
|---|
133
| 180
| 313
|
Additional Notes
- The number of water treatment systems listed above includes households that got a full water test from OHA and those that got a nitrate test from the Morrow County Health Department in 2022. The maps and data tables above that show nitrate test results only include the tests done by OHA. This means that the number of treatment systems listed may be different from the number of households that are eligible for treatment through OHA testing. These are households with nitrate levels between 10 and 25 milligrams per liter of water.
- UPDATE February 5, 2025: The number of systems installed in Umatilla County reduced from 120 (December 2024) to 117 (January 2025), due to duplications found in our records.
- UPDATE March 5, 2025: The number of systems installed in Morrow County reduced from 103 (January 2025) to 100 (February 2025), due to duplications found in our records.
Households Receiving Water Delivery
| Morrow | Umatilla | Total |
|---|
332
| 309
| 641
|
Retesting Table Now Updated Every 3 Months
Starting August 2025, OHA will update the retesting data tables every 3 months. This matches how often some homes (those with nitrate levels between
5 - 9.99 mg/L) need their water tested again. These homes are checked more often because their water could become unsafe over time.
Efforts to Retest Households with Levels of Nitrate between 5.0 - 9.99* mg/L - in Quarter 1 of 2026 (January-March)
|
Morrow |
Umatilla |
Total |
|---|
Total number of households to be contacted
| 47
| 94
| 141
|
|---|
Attempts to contact for retesting (at least 1 attempt made)
| 47
| 94
| 141
|
|---|
Tested
| 20
| 33
| 53
|
|---|
Declined
| 11
| 14
| 25
|
|---|
Households we could not reach
| 16
| 47
| 63
|
|---|
*Thi
s level is close to the EPA limit of 10 mg/L.