You can get these materials in other languages, large print, braille or a format you prefer free of charge. Contact us at
prevention.info@odhsoha.oregon.gov.
STI Dashboards
The chlamydia, gonorrhea, and syphilis reports show the incidence rate in all Oregon counties, demographic information, treatment and the percentage of some of the factors affecting each disease. Incidence rates are shown for the last decade and treatment and factors affecting disease show only recent data.
Each disease report has tabs to navigate across the data on the top of the page and has filters to select a specific year in the top right corner.
Weekly CD Surveillance Report
The weekly communicable disease surveillance report looks at a selection of reportable diseases in Oregon. The report presents case counts by report week and compares current data to historical trends. The report is only available for the current week. The weekly report is now available in an interactive dashboard on Tableau Public. Weekly data are preliminary and will change as cases are reported, reviewed and updated.
To view chlamydia, gonorrhea, HIV, congenital syphilis, early syphilis, and tuberculosis data, choose the disease from the "Select a disease to view" dropdown menu.
National STI Data
CDC 2024 STI Surveillance Report: CDC's most recent STI data by jurisdiction. Contains figures, data points, and tables.
NCHHSTP AtlasPlus has charts, maps, and tables functions. Using any of these functions, you can view diseases by year, geography, and demographics.
Rates of STI Infection in Oregon by Year, 2019-2025
Click any graph below to enlarge.
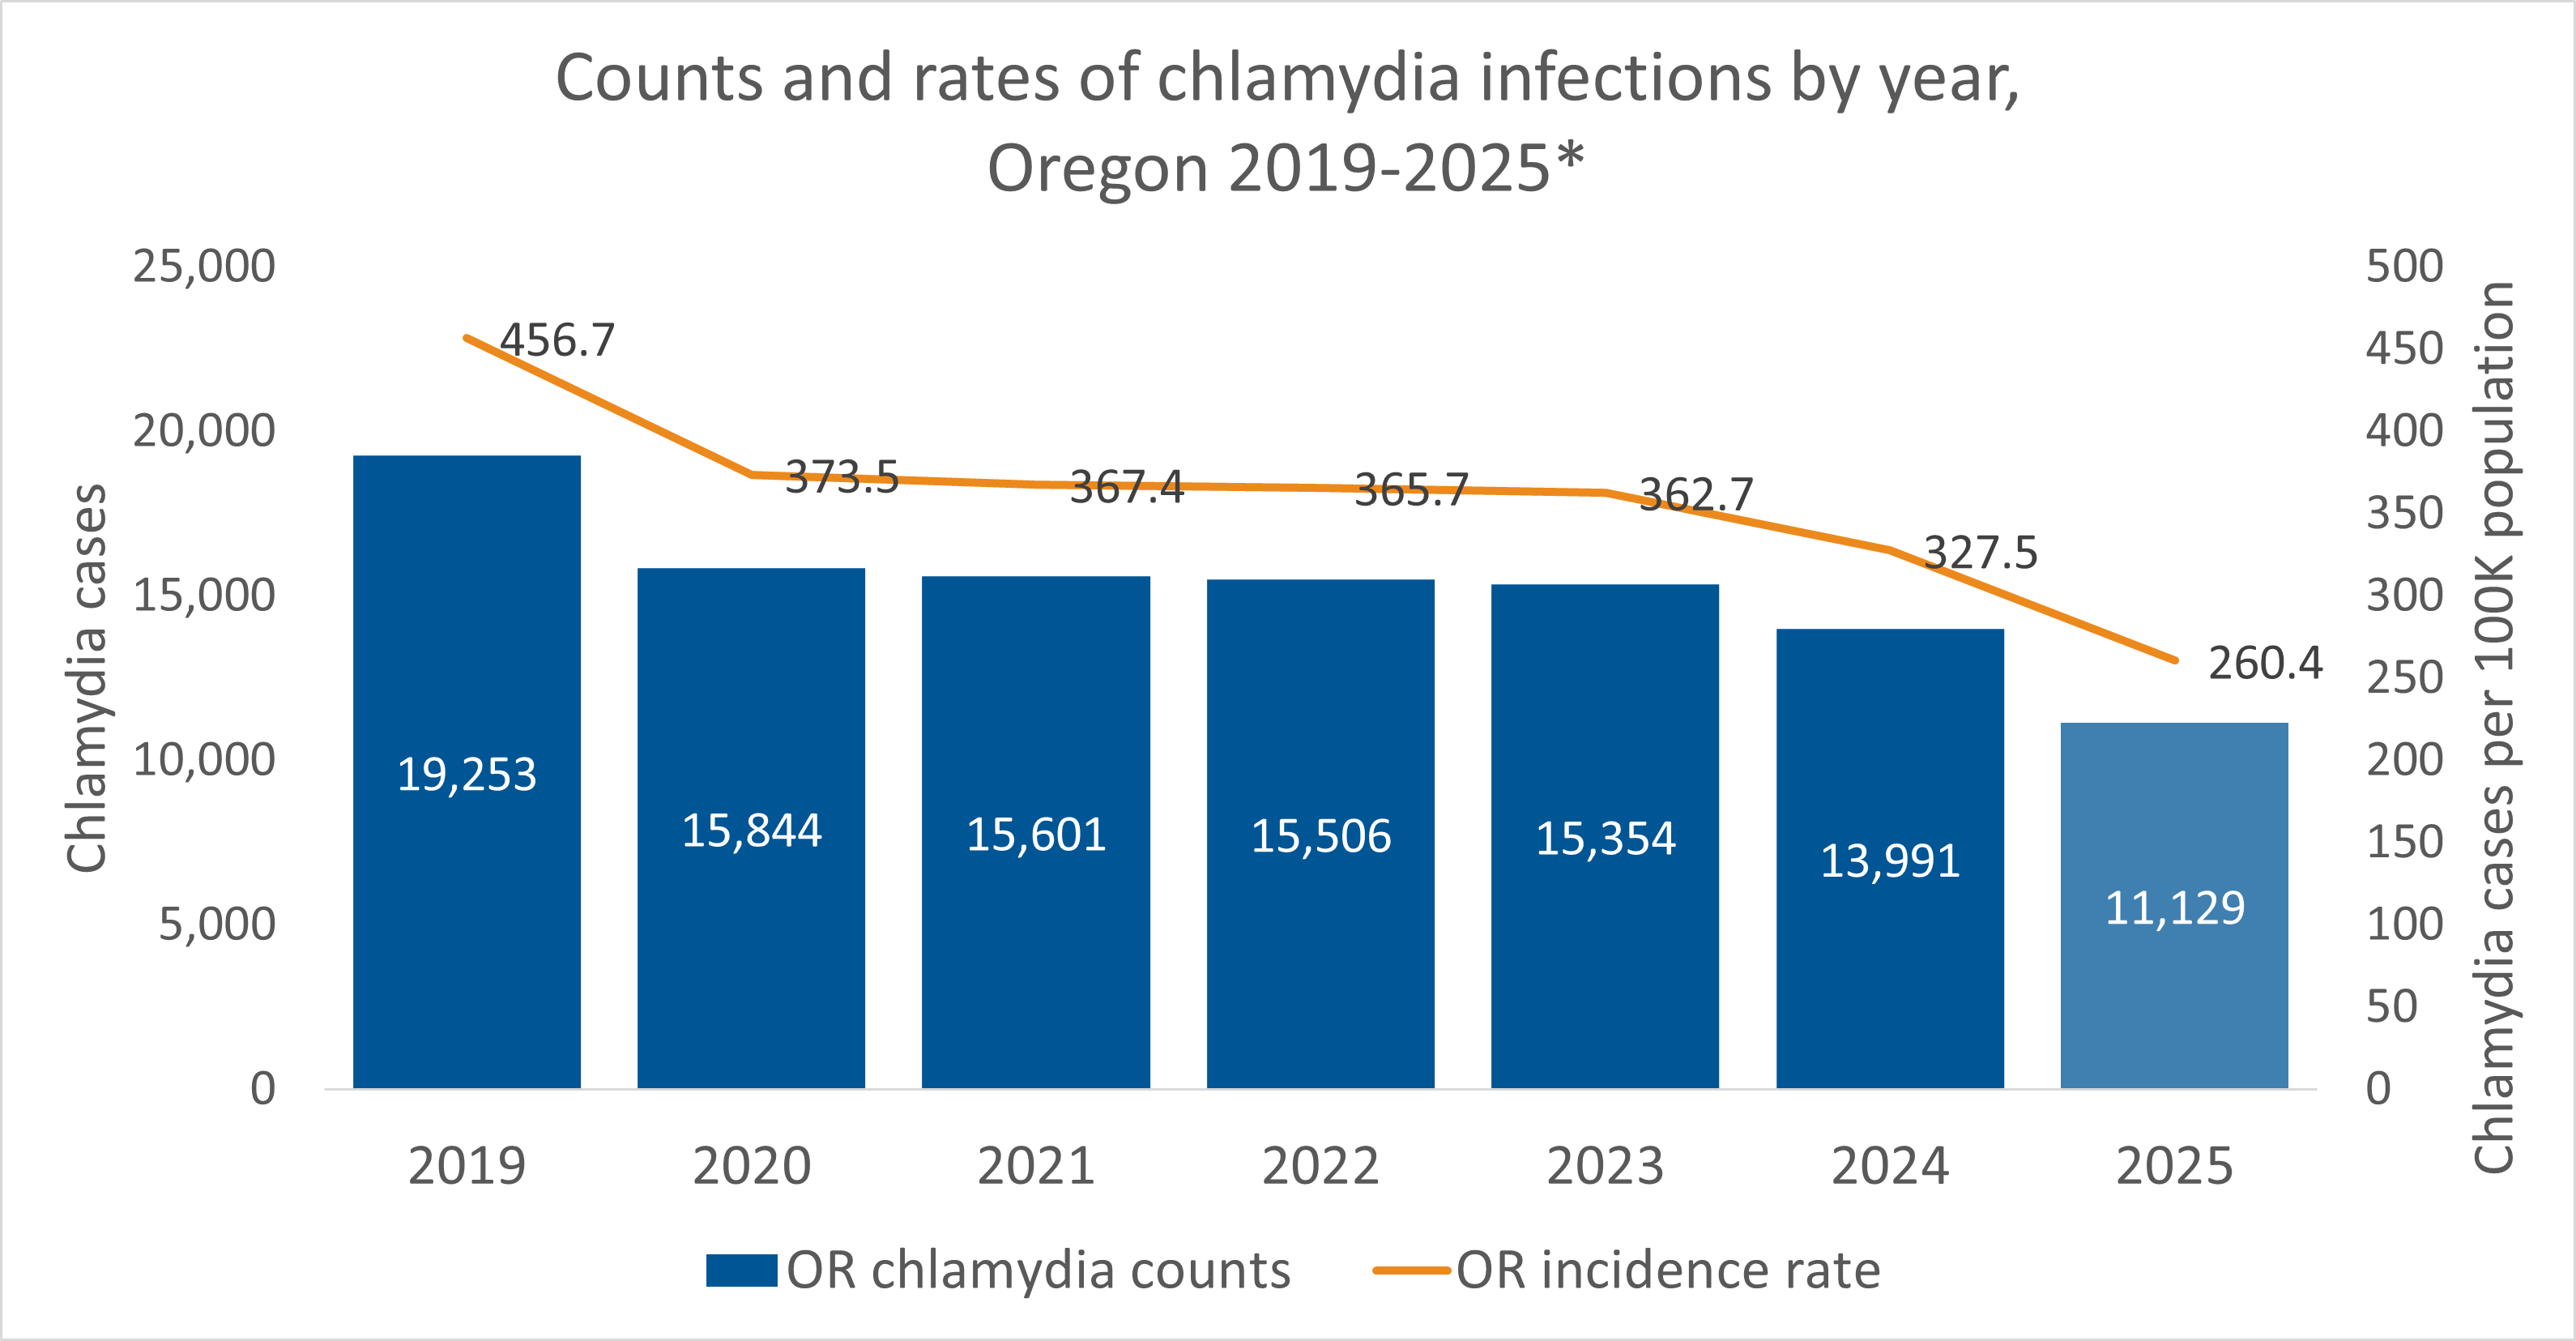 Figure 1. Chlamydia counts and incidence rates are confirmed and presumptive surveillance cases. Rates are new diagnoses per 100,000 population. Interpret 2020 and 2021 data with caution due to the impact of COVID-19 on chlamydia testing.
* Data from 2025 are not final and subject to change.
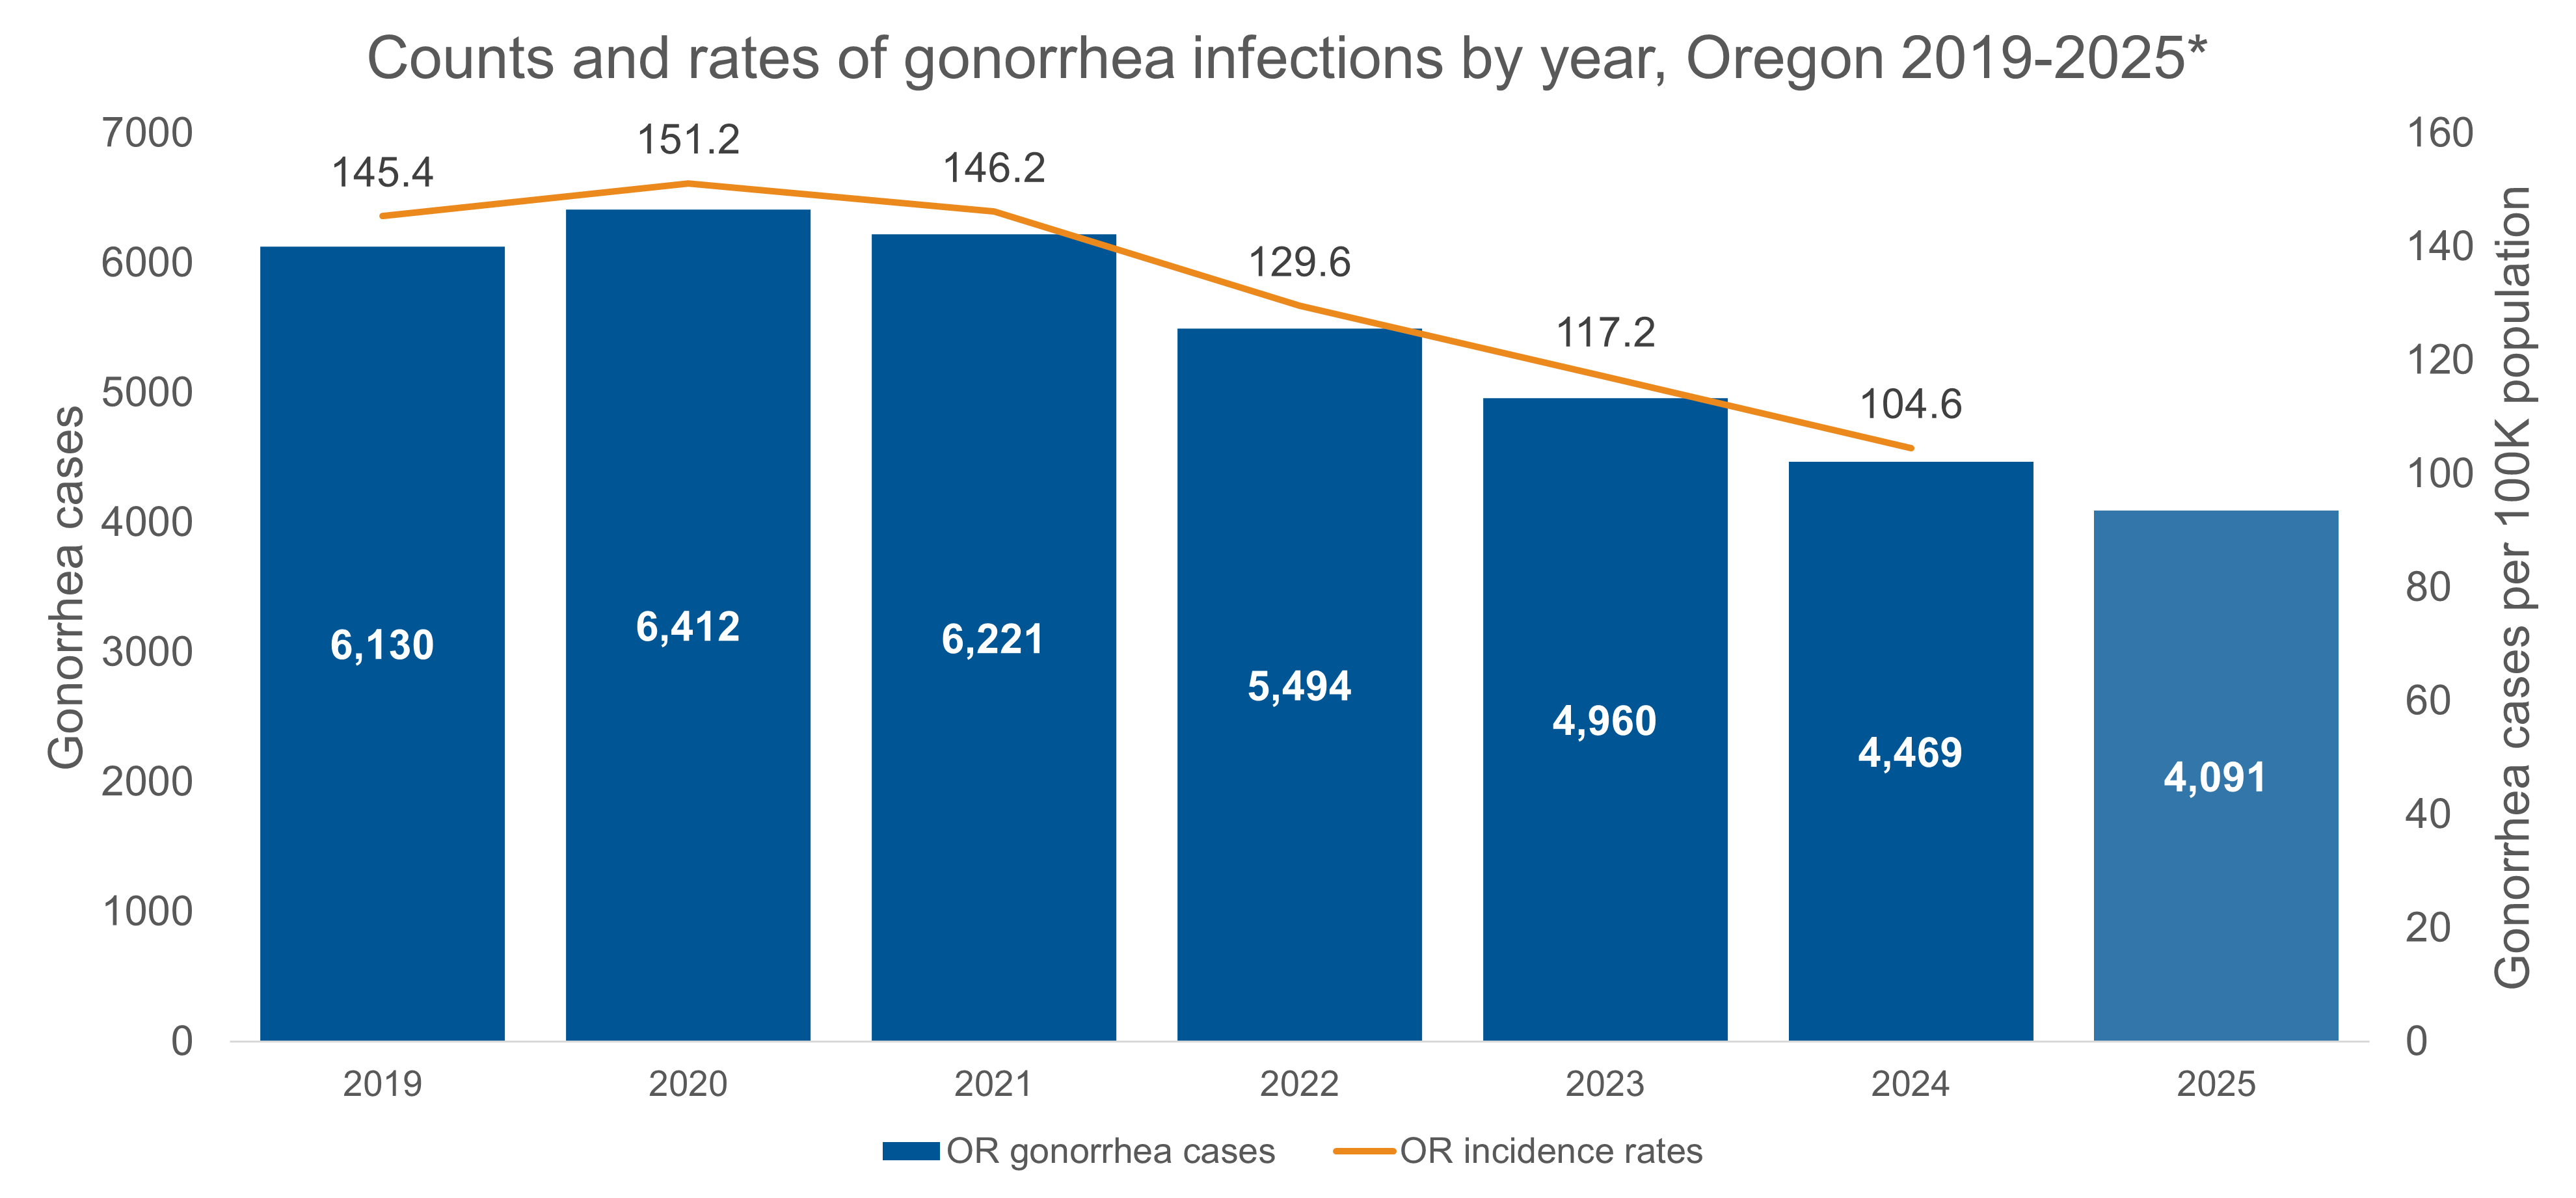 Figure 2. Gonorrhea counts and incidence rates are confirmed and presumptive surveillance cases. Rates are new diagnoses per 100,000 population. Interpret 2020 and 2021 data with caution due to the impact of COVID-19 on gonorrhea testing.
* Data from 2025 are not final and subject to change.
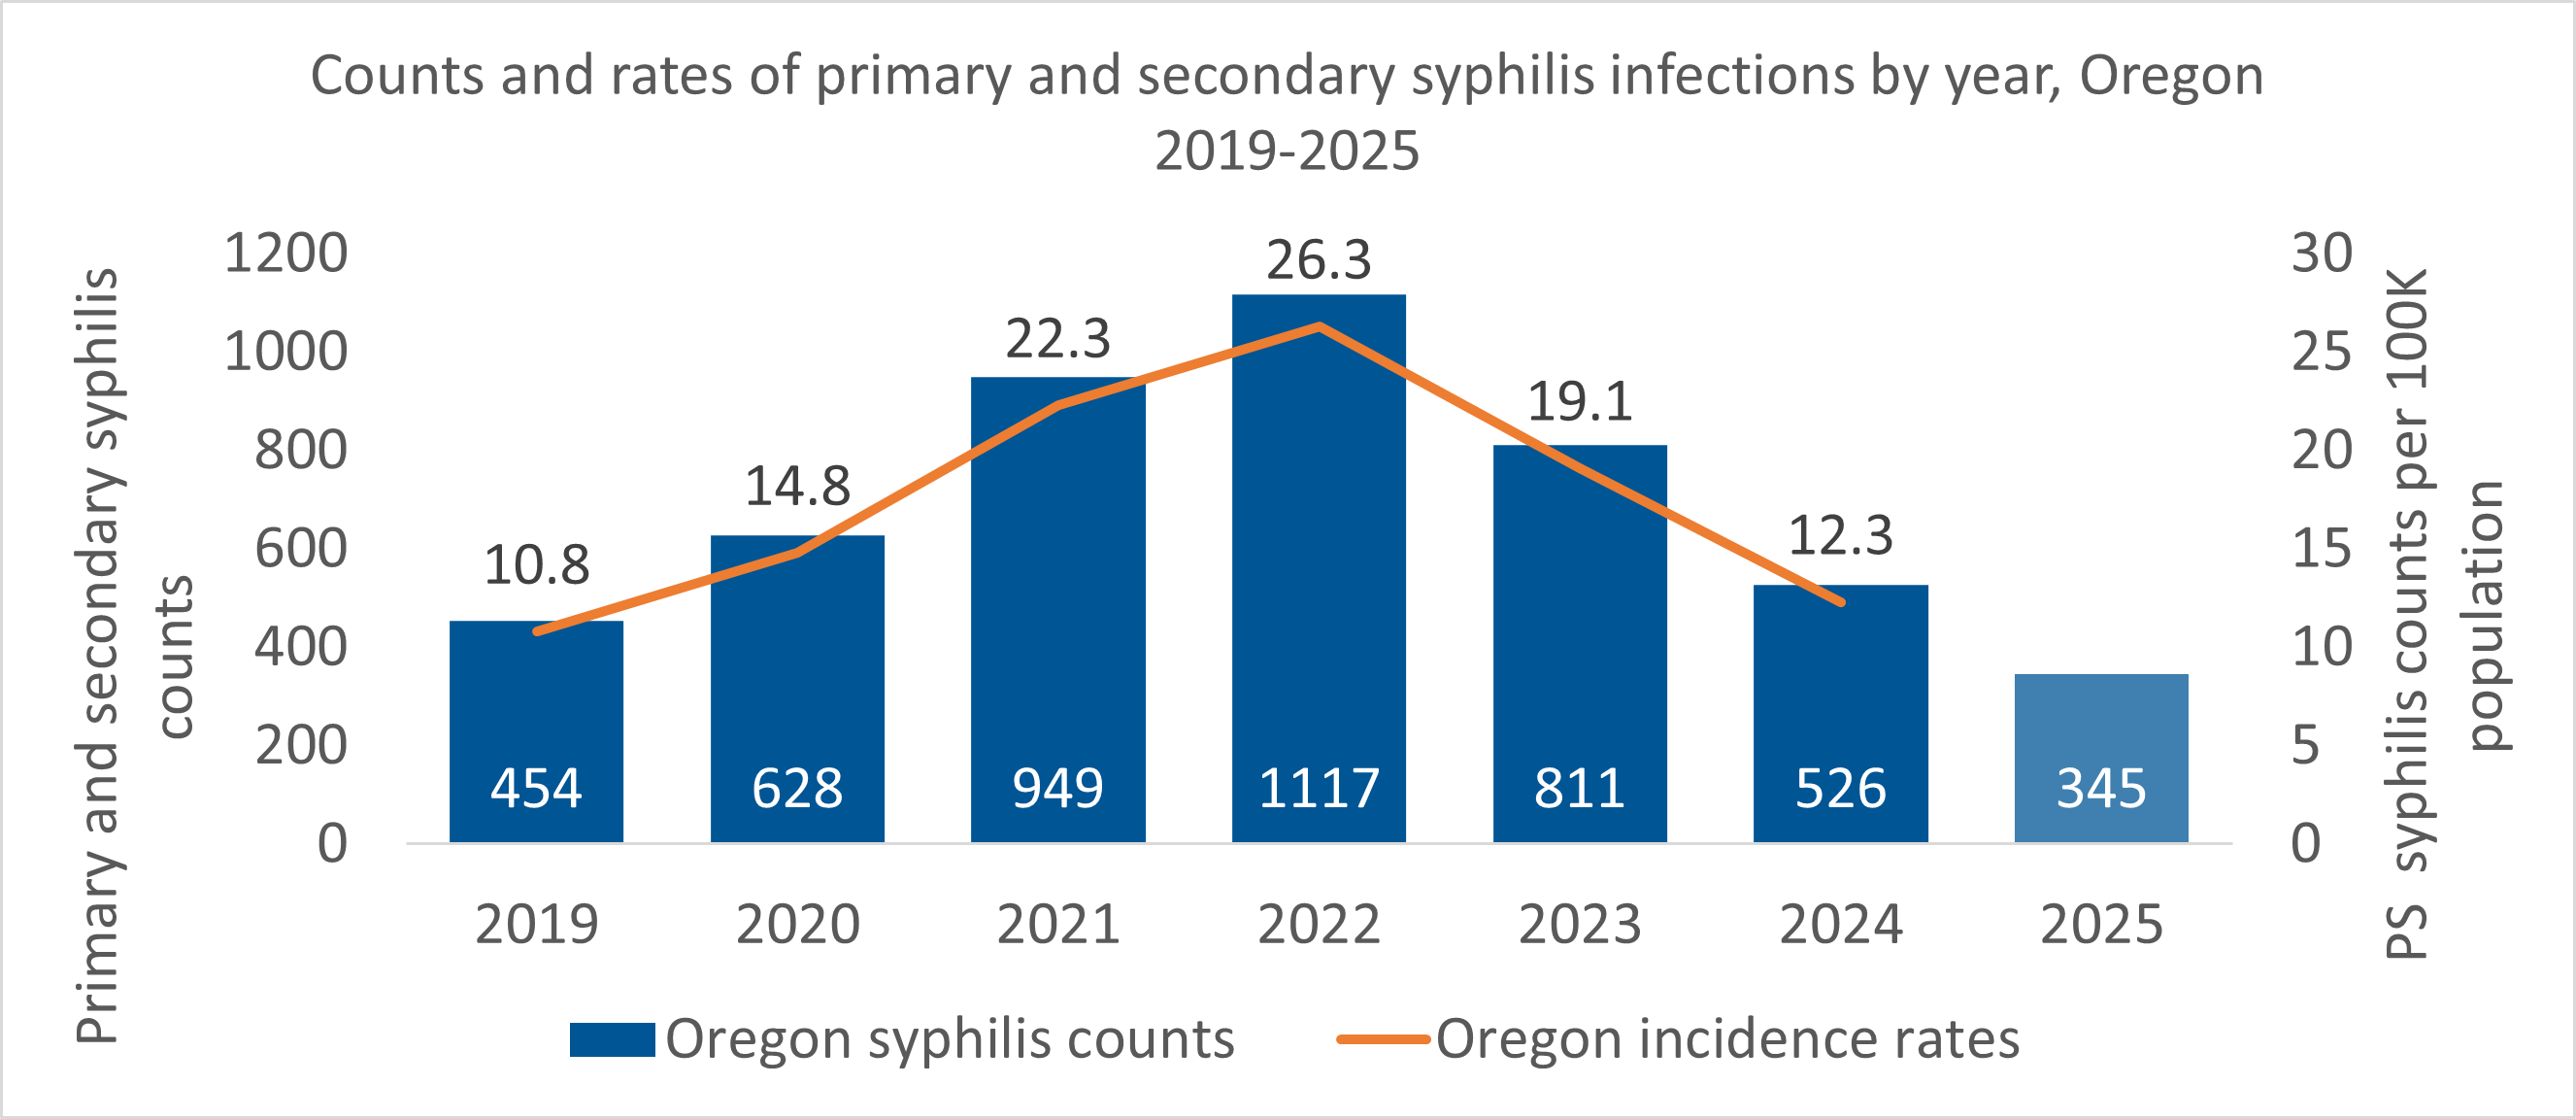 Figure 3. Primary and secondary syphilis counts and incidence rates are confirmed and presumptive surveillance cases. Rates are new diagnoses per 100,000 population. Interpret 2020 and 2021 data with caution due to the impact of COVID-19 on syphilis testing and diagnoses.
* Data from 2025 are not final and subject to change.
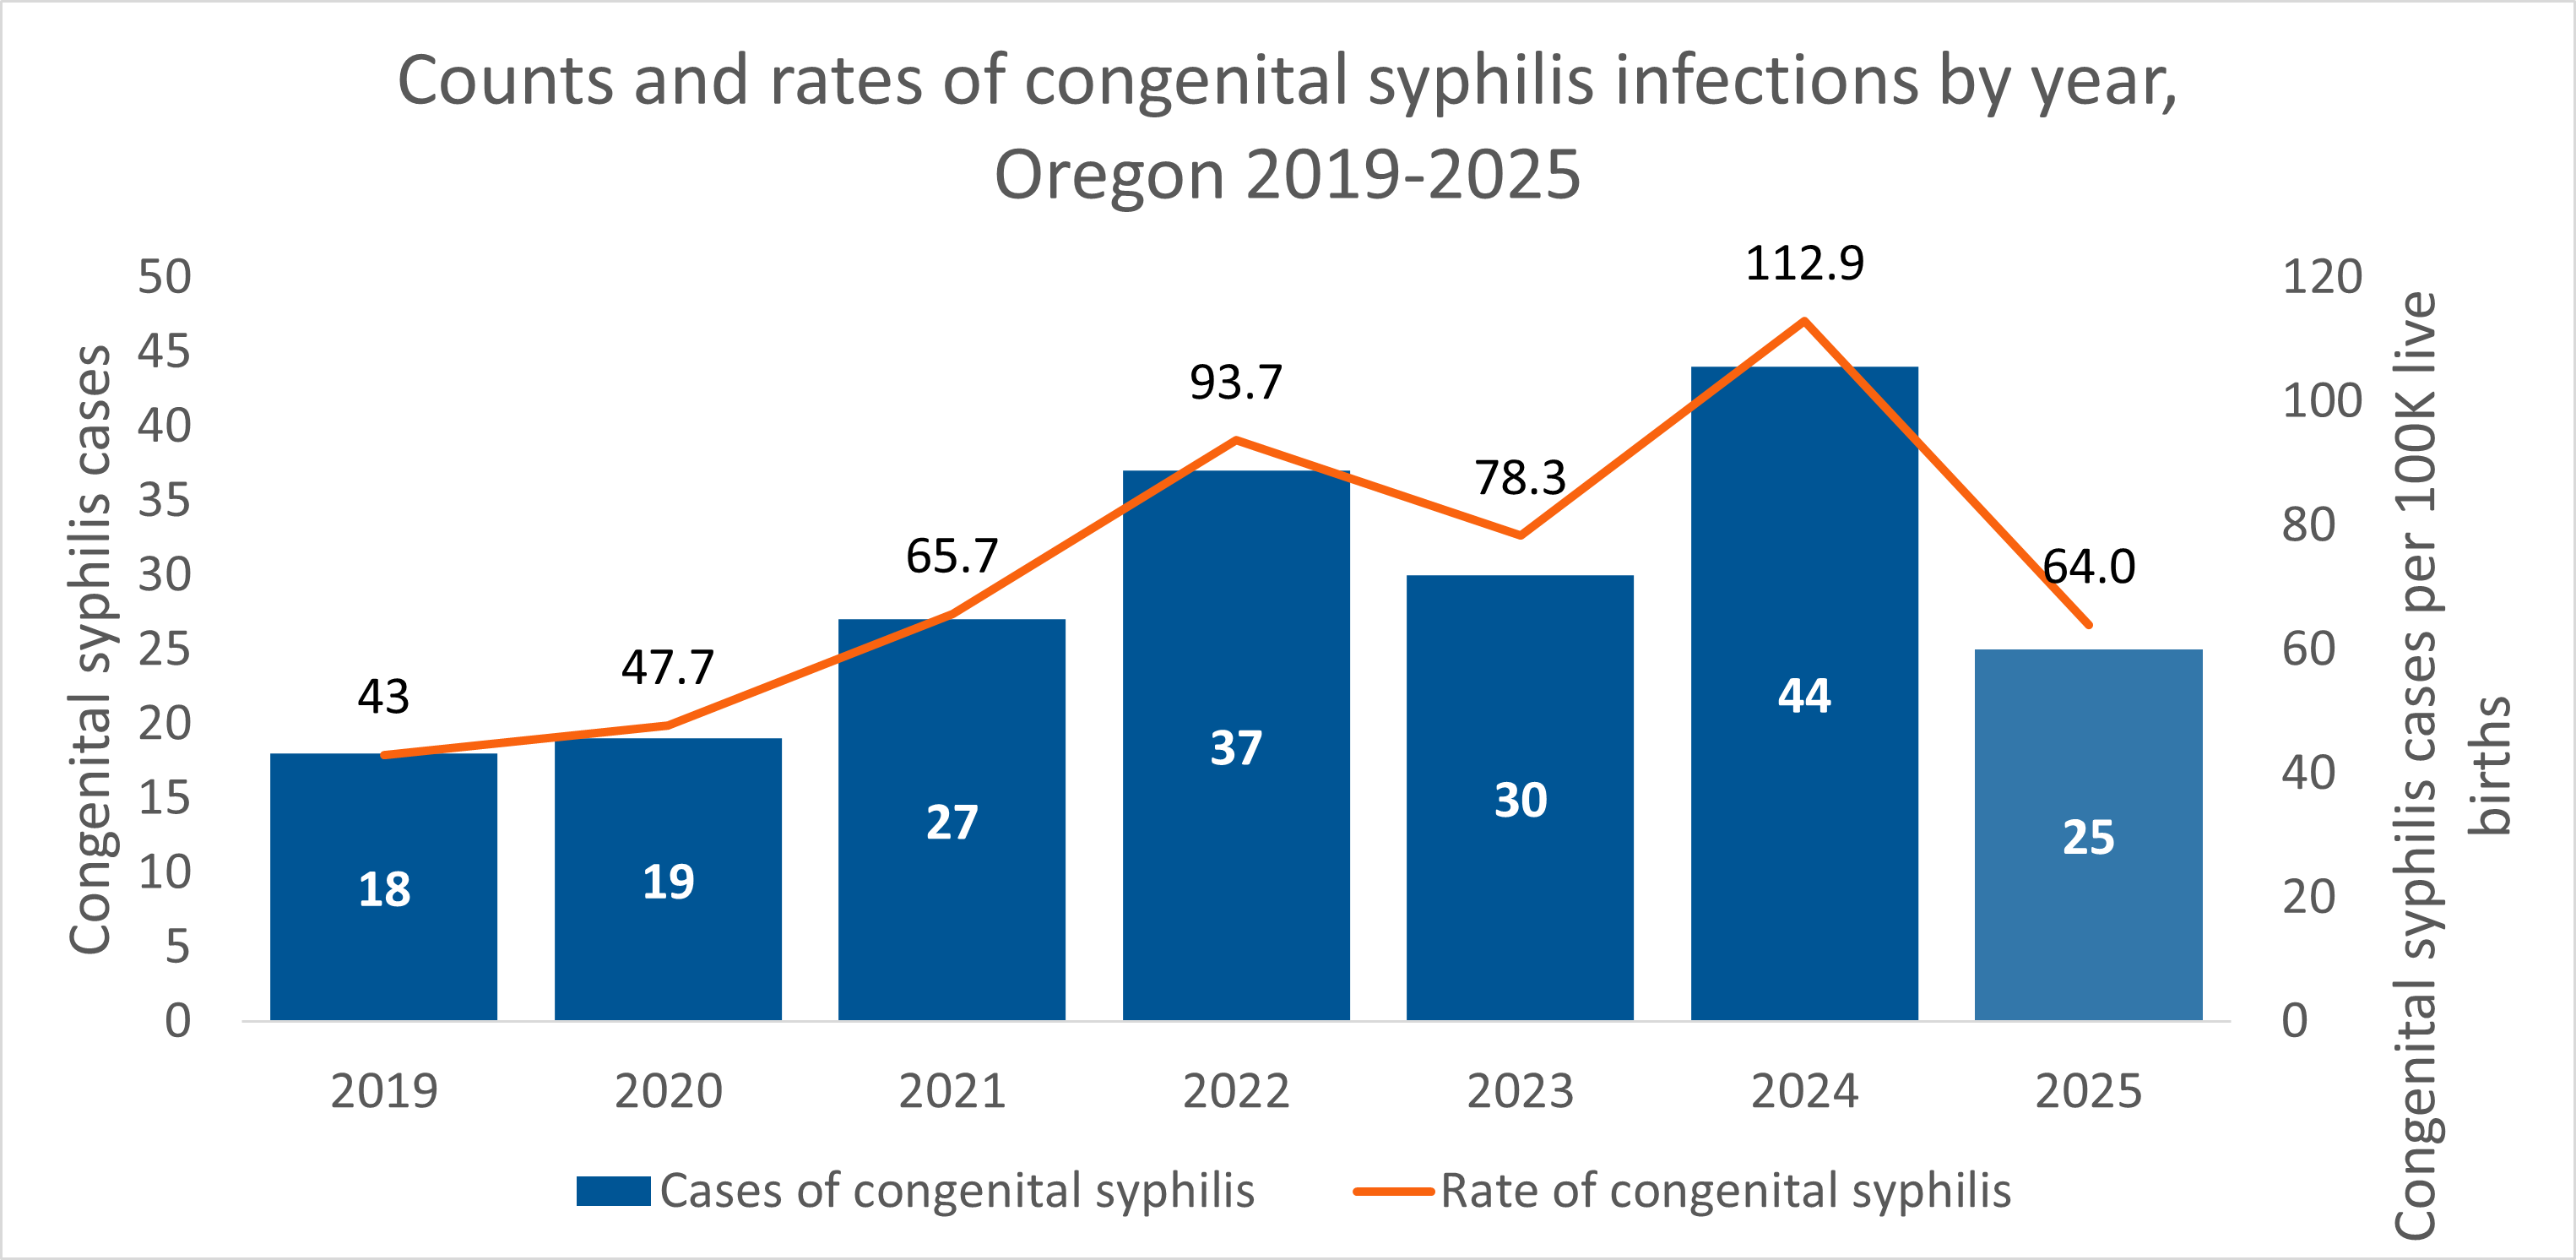
Figure 4. Congenital syphilis counts and incidence rates are confirmed and presumptive surveillance cases. Rates are new diagnoses per 100,000 live births.
* Data from 2025 are not final and subject to change.
|
|