
Agency Trust
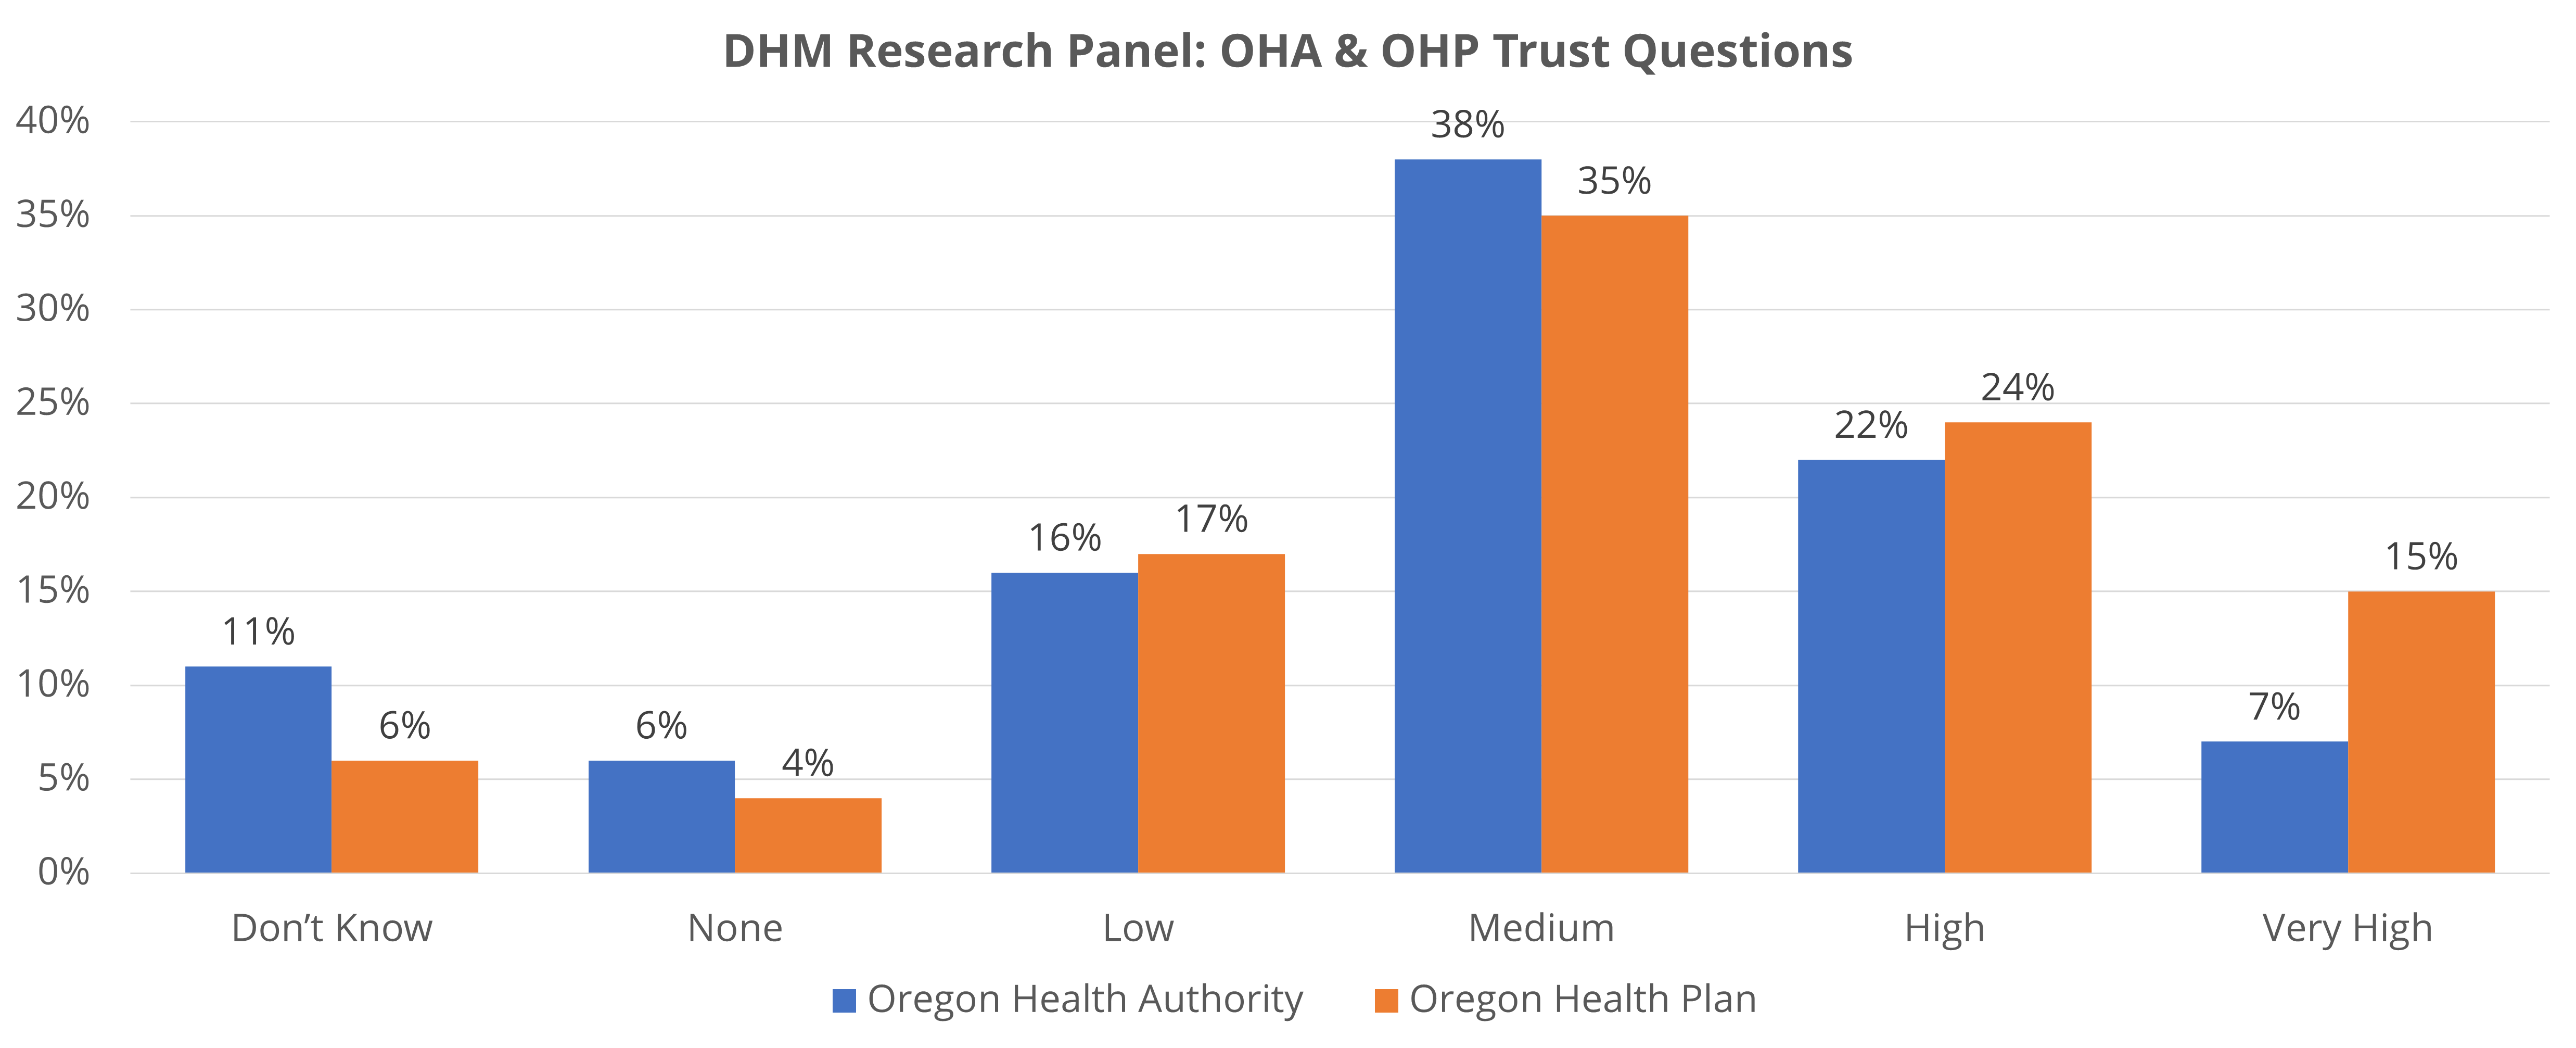
From September 26 to October 1, 2024, DHM Research conducted a survey of Oregonians to assess their opinions about a variety of current issues. The graphs below represent their responses to the following question:
What level of trust do you have in Oregon Health Authority (OHA) & Oregon Health Plan (OHP) to improve health and well-being in Oregon?
| Score | Don't Know | None | Low | Medium | High | Very High |
|---|
| Oregon Health Authority | 11% | 6% | 16% | 38% | 22% | 7% |
|---|
| Oregon Health Plan | 6% | 4% | 17% | 35% | 24% | 15% |
|---|
**Oregon DHM Panel: September 26-October 1, 2024: DHM Research Project #00836
Transparency
The Agency receives numerous public records requests which are required to be completed within 15 business days. Update: In addition to the total number of OHA processed Public Records Requests, and the percentage of OHA processed Public Records Requests that were completed within 15 days, the metrics in this graph now include the total number of requests OHA redirected to other agencies or teams and the percentage of those requests that were completed within 15 days.
OHA receives a number of requests for information via the public records email inbox that need to be re-directed to other agencies and teams for processing, such as vital records, immunization records, and county records. Previously, data from these requests was not tracked, but as the number of these requests and the associated volume of time required to redirect these requests has increased, the agency felt it was important to highlight this information.
Note, as metrics on the percentage of redirected requests completed within 15 days started being tracked in January 2025, the graph does not include 2024 data. For more information, please visit the
OHA Public Records Request webpage.

| Date | Number of Public
Records Requests | Percent Complete
in 15 Business Days | Number of Redirected
Requests for
Information* | Percent Complete
in 15 Business Days* |
|---|
| Jan 24 | 153 | 95% | Not Available* |
|---|
| Feb 24 | 111 | 95% |
|---|
| Mar 24 | 109 | 93% |
|---|
| Apr 24 | 114 | 94% |
|---|
| May 24 | 104 | 95% |
|---|
| Jun 24 | 102 | 92% |
|---|
| Jul 24 | 111 | 94% |
|---|
| Aug 24 | 98 | 92% |
|---|
| Sep 24 | 104 | 95% |
|---|
| Oct 24 | 96 | 97% |
|---|
| Nov 24 | 85 | 96% |
|---|
| Dec 24 | 80
| 99% |
|---|
| Jan 25 | 100 | 95% | 81 | 97% |
|---|
| Feb 25 | 97 | 97% | 97% | 98% |
|---|
The target percentage completed within 15 business days is 98%.
*Metrics covering the number of redirected requests and the percentage of redirected requests completed within 15 days started being tracked in January 2025.
Accountability
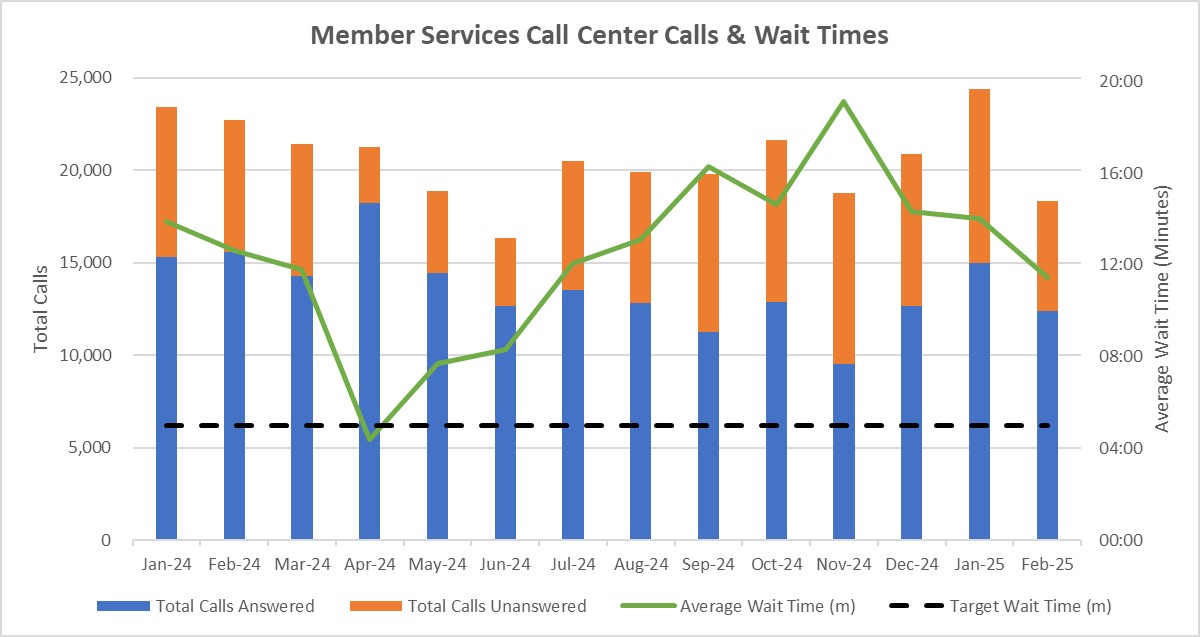
OHA continuously tracks the responsiveness of the various call centers serving the community including providers, CCOs, Medicaid members, and others. Call centers represent one of the ways in which the agency is responsive to individuals engaging with the agency. The below graph represents the number of calls and average wait times over the past 13 months.
| Date | Total Calls Unanswered | Total Calls Answered | Average Wait Time (minutes)
|
|---|
| Jan 24 | 8,078 | 15,325 | 13:54 |
|---|
| Feb 24 | 7,116 | 15,596 | 12:36 |
|---|
| Mar 24 | 7,101 | 14,305 | 11:48 |
|---|
| Apr 24 | 3,046 | 18,213 | 04:22 |
|---|
| May 24 | 4,466
| 14,435 | 07:42 |
|---|
| Jun 24 | 3,682 | 12,659 | 08:18 |
|---|
| Jul 24 | 6,946 | 13,543 | 12:03 |
|---|
| Aug 24 | 7,101 | 12,806 | 13:05 |
|---|
| Sep 24 | 8,567 | 11,255 | 16:16 |
|---|
| Oct 24 | 8,738 | 12,877 | 14:38 |
|---|
| Nov 24 | 9,272 | 9,520 | 19:08 |
|---|
| Dec 24 | 8,173 | 12,685 | 14:20 |
|---|
| Jan 25 | 9,425 | 14,983 | 14:00 |
|---|
| Feb 25 | 5,960
| 12,380 | 11:26 |
|---|
The target average maximum wait time is five minutes.
As part of normal call center operations, not every call will be answered. This may be for a number of reasons including long wait times, the number of agents working, the individual called the wrong call center, they found an answer, or do not wish to be on hold for any period of time.
Belonging
During Q4 of 2023 and 2024, Gallup conducted a survey of OHA staff to assess their opinions about employee engagement. The graph below represents the average response scores in 2023 and 2024 to the following Belonging-related questions on a scale from 1 to 5, with 1 being Strongly Disagree and 5 being Strongly Agree:
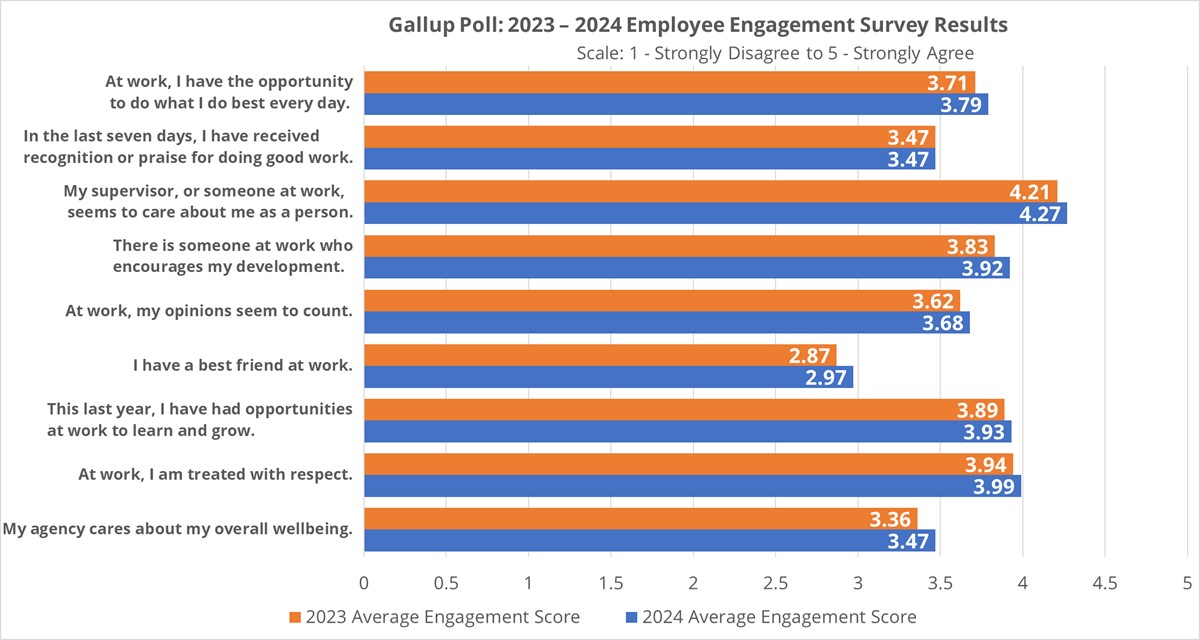
2023 Average Belonging Score: 3.66
2024 Average Belonging Score: 3.72
Belonging-Related Gallup Survey Question
| 2023 Engagement Mean
| 2024 Engagement Mean |
|---|
| At work, I have the opportunity to do what I do best every day. | 3.71 | 3.79 |
|---|
In the last seven days, I have received recognition
or praise for doing good work. | 3.47 | 3.47 |
|---|
My supervisor, or someone at work,
seems to care about me as a person. | 4.21 | 4.27 |
|---|
| There is someone at work who encourages my development. | 3.83 | 3.92 |
|---|
| At work, my opinions seem to count. | 3.62 | 3.68 |
|---|
| I have a best friend at work. | 2.87 | 2.97 |
|---|
| This last year, I have had opportunities at work to learn and grow. | 3.89 | 3.93 |
|---|
| At work, I am treated with respect. | 3.94 | 3.99 |
|---|
| My agency cares about my overall wellbeing. | 3.36 | 3.47 |
|---|
| Average Score Amongst All Belonging-Related Questions | 3.66 | 3.72 |
|---|
We are targeting 5% overall improvement annually.