Get tips for using these data maps
Oregon State Health Indicators
VIEW MAPS: 2011-2017 | 2009 - 2015 | 2007 - 2013
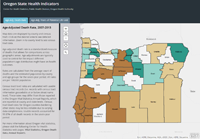
These maps display mortality-related state health indicators. They were created in response to a growing demand for health indicator data at the county and census tract levels. To protect Oregonians' confidentiality and ensure data reliability, seven years of data were combined for the following health indicators:
- Age-adjusted mortality rate
- Age-adjusted years of potential life lost
- Age-adjusted cancer death rate
- Age-adjusted heart disease death rate
- Age-adjusted chronic lower respiratory death rate
- Age-adjusted cerebrovascular heart disease death rate
- Age-adjusted unintentional injury death rate
- Age-adjusted suicide death rate
Data source: Death records compiled by the Oregon Center for Health Statistics
Technical Notes (PDF)
Life Expectancy at Birth by Oregon Census Tract (USALEEP)

VIEW MAP: 2010 - 2015
This map shows estimated life expectancy at birth by Oregon census tract for the period 2010-2015. Life expectancy at birth is the average number of years a newborn is expected to live if mortality rates at the time of birth remain the same. Census tracts include an average of 4,000 people who typically have similar characteristics, such as social and economic status.
Please see our Life Expectancy in Oregon page for more information, including a downloadable file of the data.
Data source: The National Center for Health Statistics, with death records compiled by the Oregon Center for Health Statistics, 2010 decennial census population counts, and American Community Survey 5-year population
estimates
National Methodology and Results (PDF)
Tips for using data maps
- We recommend maximizing your browser window and using Mozilla Firefox or Google Chrome to view the maps.
- Allow a few moments for the maps to load.
- Once the maps have loaded, use the tabs across the top to view individual maps.
- You can click on an individual county to open a pop-up window with detailed data for that county.
- Zoom in to access census tracts or ZIP codes. If you select a county, you can click Zoom to at the bottom of the pop-up window to zoom in to that county.
 Use the zoom tool to zoom in or out, or to return to the "home" view.
View all data maps