Summary Statistics
The table below shows the total number of reports included in this analysis. The number of reports corresponds to the number of property financial reports used for analysis. As of April 2026, there were approximately 1,287 properties in the OHCS portfolio, or receiving some form of OHCS funding. As previously stated, not all funding streams require financial reporting.
For FY21-3, the number of reports matches the study from last year. However, the number of units has slightly changed, due to a fix in ProLink when single sites were consolidated into scattered sites. These unit count numbers above are updated and correct.
Overall, there are 796 unique properties (50,444 units) in this dataset over four years.
Financial Metrics
The tables below show the main portfolio-wide analysis, along with the corresponding year-over-year (YoY) percentage changes. While the year-over-year data offers valuable insights, compounded annual growth rates (CAGR) provide a clearer view of long-term trends by minimizing short-term fluctuations. However, since this study spans only four years, researchers have begun calculating CAGR and plan to do so more in the future.
Notes on Table 2
- Vacancy Loss: OHCS does not have this data for the full 2021 and 2022 dataset and only calculated based on the information available.
- Debt Coverage Ratio: Only calculated for properties that have annual senior debt service
Some of the year-over-year percentage changes are mathematically correct but not especially meaningful. Vacancy loss is a good example: Because the underlying rates start from a low baseline, even a modest shift produces a disproportionately large percentage change.
Net operating income (NOI) per unit remained relatively stable over the four-year period, decreasing slightly from $3,504 in FY21 to $3,089 in FY22, before rising to $3,238 in FY23 and $3,441 in FY24.
Cohort Analysis from FY23 to FY24
As noted earlier, this analysis reflects the entire OHCS portfolio of properties required to submit financial reports. It does not track a fixed cohort of projects over time; instead, it evaluates year to year changes across all reporting properties. To understand whether shifts in operating or financial metrics were driven by properties coming into or leaving the reporting universe, OHCS also reviewed a cohort consisting of properties that reported in both FY23 and FY24.
Of the 700 properties reporting in FY23, 28 did not submit FY24 financials, either because they left service or no longer required reporting, resulting in a cohort of 672 properties with reports in both years. The FY24 portfolio includes 737 properties in total. Across nearly all metrics, the cohort performs only slightly worse than the full portfolio, indicating that portfolio level changes are not being fully driven by newly added properties.
The main exception is cash flow per unit. Unlike DCR, which incorporates just senior hard debt, the cash flow metric incorporates both senior and junior hard debt. The larger gap in cash flow between the portfolio and the cohort therefore suggests that junior debt service obligations are higher among the existing properties, while newly added FY24 properties generally carry less junior debt.
The remainder of this report continues with analysis of portfolio-wide metrics.
Debt Coverage Ratio
It is important to note that NOI does not measure the true financial picture of the OHCS portfolio and does not include payments such as principal debt payments and deposits to the replacement reserves. Debt Coverage Ratio (DCR) accounts for these payments:
DCR = (NOI – annual deposit to replacement reserve) / annual senior hard debt service
DCR increased for the first time in this study period from FY23 to FY24, going from 1.34 to 1.47. The percentage of properties with a DCR below 1.1 decreased from FY23 to FY24, going from 39% to 33%. The increase in DCR follows trends seen in other national-level studies, including the
CohnReznick 2025 Affordable Housing Credit Study, which found that DCR rose from 1.37 in 2023 to 1.46 in 2024. Both the OHCS study and the CohnReznick study found that FY24 numbers are not quite back to FY21 levels. In Oregon, FY21 DCR averaged 1.72, and 24% of properties had a DCR below 1.1. DCR increased because annual senior hard debt service stabilized in FY24, at $2,517/unit, a 2% increase from FY23, and NOI increased. This aligns with market conditions in FY24, including stabilization of interest rates and some refinances correcting FY22-23 spikes. Only calculated for properties that have annual senior debt service.
For further clarification, a DCR threshold of 1.1 was chosen as an industry standard because it represents the minimum requirement for modeling a property’s financial feasibility. The percentage is more useful than the number of properties, since the number of properties in our dataset increased overall from FY21 to FY24. While 33% of properties reported a DCR below 1.1, enough well-performing properties helped raise the overall average to 1.47. As a comparison, the FY24 median DCR is 1.34.
Income to Expense Ratio
Not all properties in the OHCS portfolio carry debt – DCR is calculated just for properties with annual debt service. In FY23, 10% of the portfolio (68 total) reported no senior debt service, and in FY24 this increased to 12% (92 properties). Income to expense ratio is an alternative metric to DCR that works for properties that do not have debt service. An income to expense ratio over 1 means a project is generating more revenue than it spends. Income to Expense Ratio improved slightly in FY24, rising to 1.41.
Cash Flow Per Unit
This DCR calculation presents similar information to a cash flow analysis but in a different format. DCR is a ratio that measures how well income covers debt, and cash flow is a dollar amount showing how much money remains after paying expenses and debt. Cash flow per unit is calculated as:
Cash Flow = (NOI – annual deposit to the replacement reserve – annual senior and junior hard debt service) / # of units
Unlike DCR, this calculation includes junior hard debt. Similar to DCR, cash flow per unit increased from FY23 to FY24, indicating improving financial performance across the portfolio.
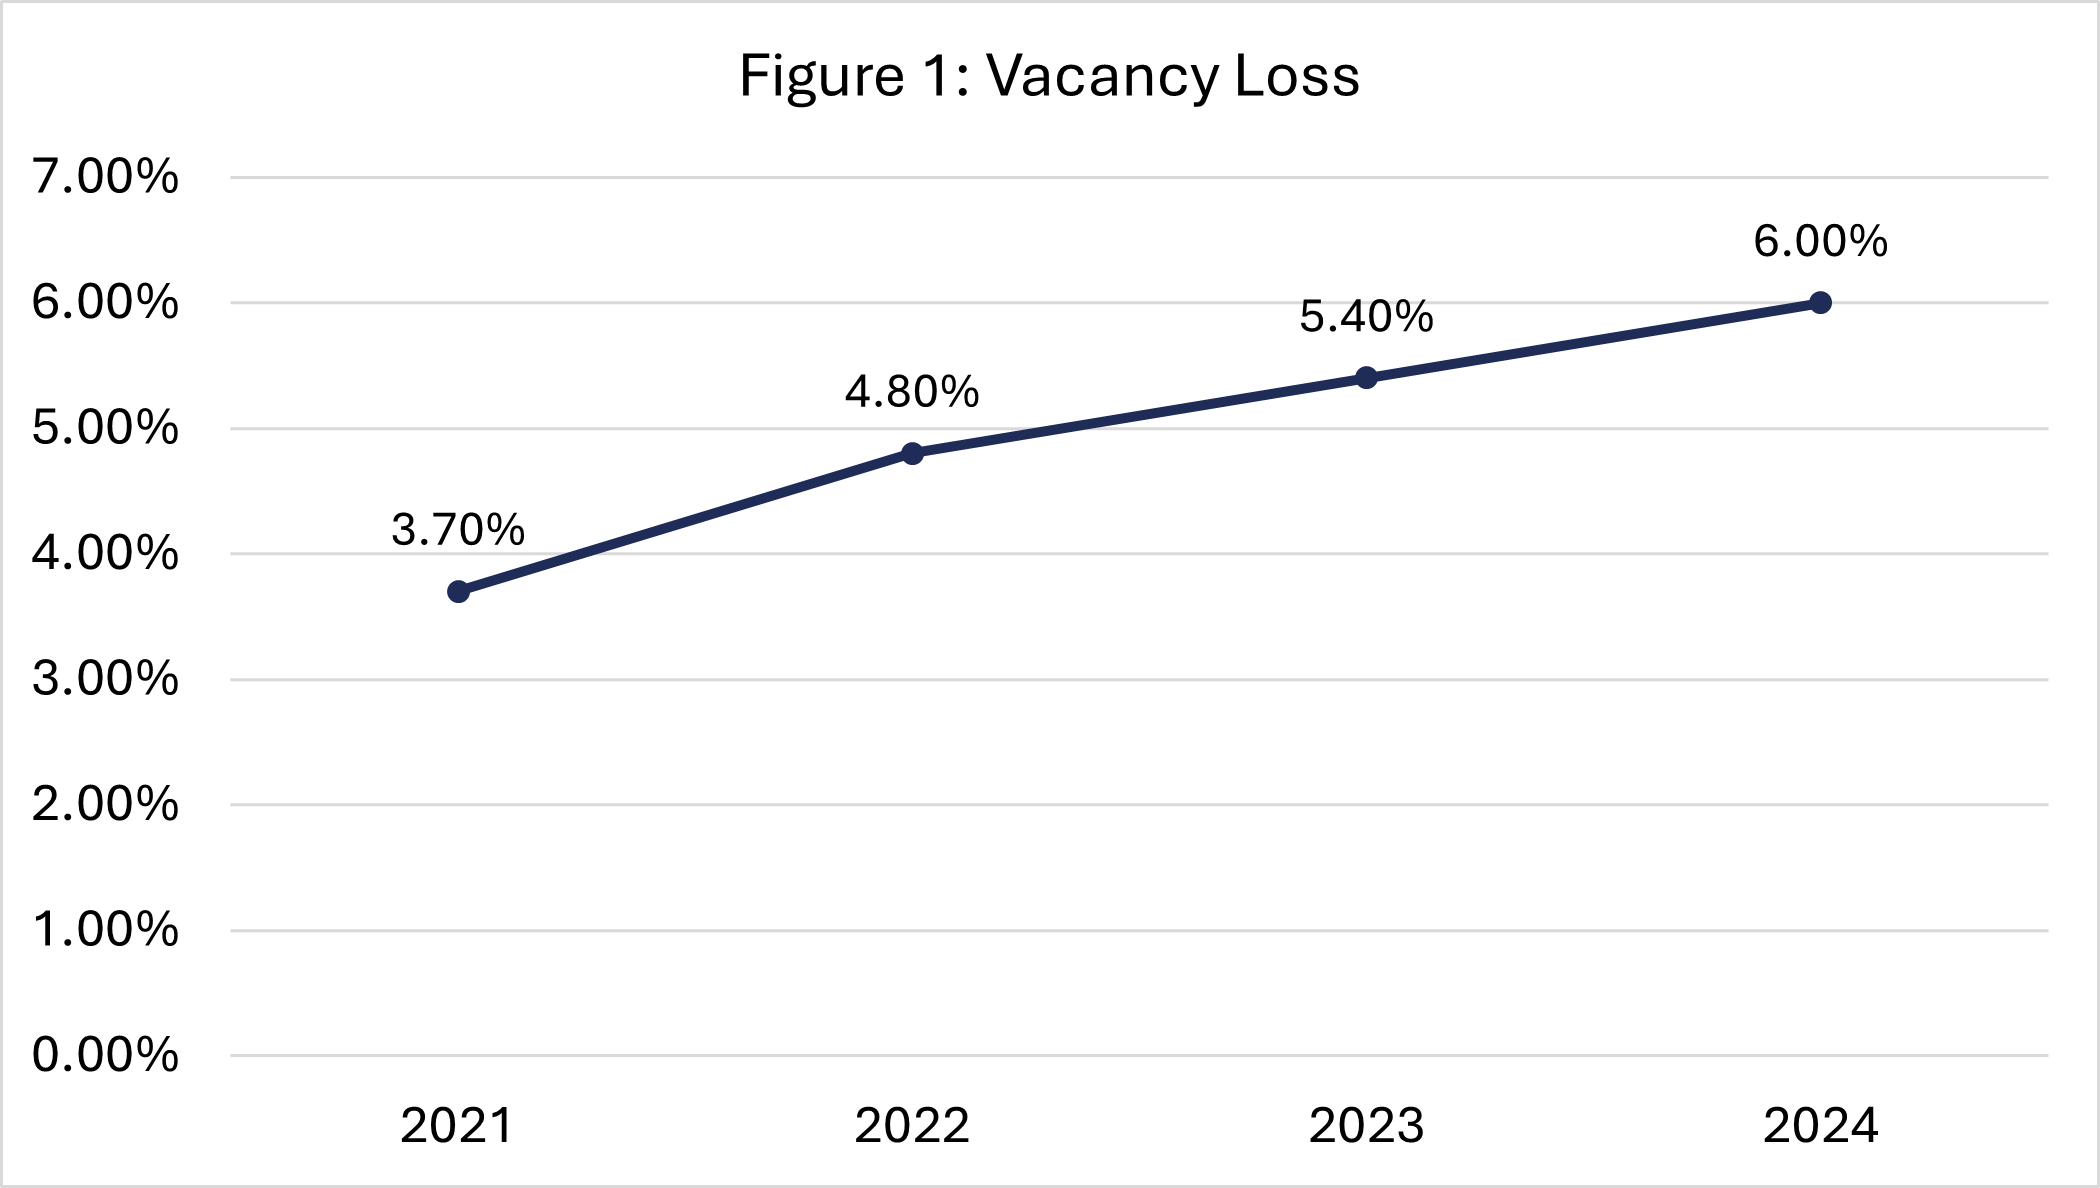
Vacancy Loss
Vacancy loss measures how much income a property is not collecting from unoccupied units, relative to the total potential rent. Gross potential revenue includes residential, commercial and parking rent, but excludes laundry, vending and other tenant fees. This metric captures only the cost of vacant units; rent not collected from occupied households is recorded as bad debt under administrative operating expenses.
Vacancy Loss = Vacancy / gross potential revenue
Historically, OHCS has underwritten projects using a 5–7% vacancy assumption to account for expected unit turnover and occasional periods of non occupancy, ensuring debt is sized to withstand normal operating conditions.
Vacancy loss increased from 3.7% in FY21 to 6% in FY24. Across the 48,059 units in this FY24 study, this represents roughly 2,892 units. Contributing factors include competition from similarly priced market-rate units, shortage of lower-Area Median Income (AMI) units and slower turnover of vacant units due to administrative requirements for both tenants and property owners.
Please note: According to 2024 American Community Survey data, 43% of Oregon renter households are high income (above 120% AMI), and 42% of non vacant units are priced at these AMI levels. Middle income renters (80–120% AMI) make up 16% of renter households, while 33% of non vacant units are priced at middle income levels. In contrast, low income renters (below 80% AMI) represent 41% of renter households, but only 25% of non vacant units are priced at a level they could afford.
Key takeaways
This report analyzes FY21-4 financial data for 796 unique properties, representing 50,444 units. DCR, a metric that includes payments such as debt payments and replacement reserve deposits, rose to 1.47; however, 33% of properties in FY24 remain below the critical threshold of 1.1. Vacancy loss rose to 6%.