This section breaks down operating and non-operating expenses across OHCS funded affordable housing properties. Major operating expense categories include administrative costs, utilities, operations and maintenance, and taxes and insurance.
Tracking expense trends provides valuable insight for affordable housing owners and policymakers. Because these properties typically operate with narrower margins than market rate housing, understanding which costs are rising, which remain stable, and how each category contributes to total operating expenses is essential. Identifying shifts in spending patterns supports more informed budgeting, planning, and policy decisions that help maintain long term property and portfolio stability.
From FY21 to FY22, average operating expenses increased by $592, or 9.4%, compared to 6.2% for inflation. This upward trend continued into FY23, with an additional increase of $740, or 10.8%, compared to 3.7% for inflation. Operating expense growth slowed in FY24 with an increase of $588, or 7.7%, yet still outpacing 2.5% in inflation.
The chart below compares the actual operating expense growth from FY21 to the standard 3% annual expense escalation in 30-year projections for development projects, alongside inflation trends based on the Western Region CPI.
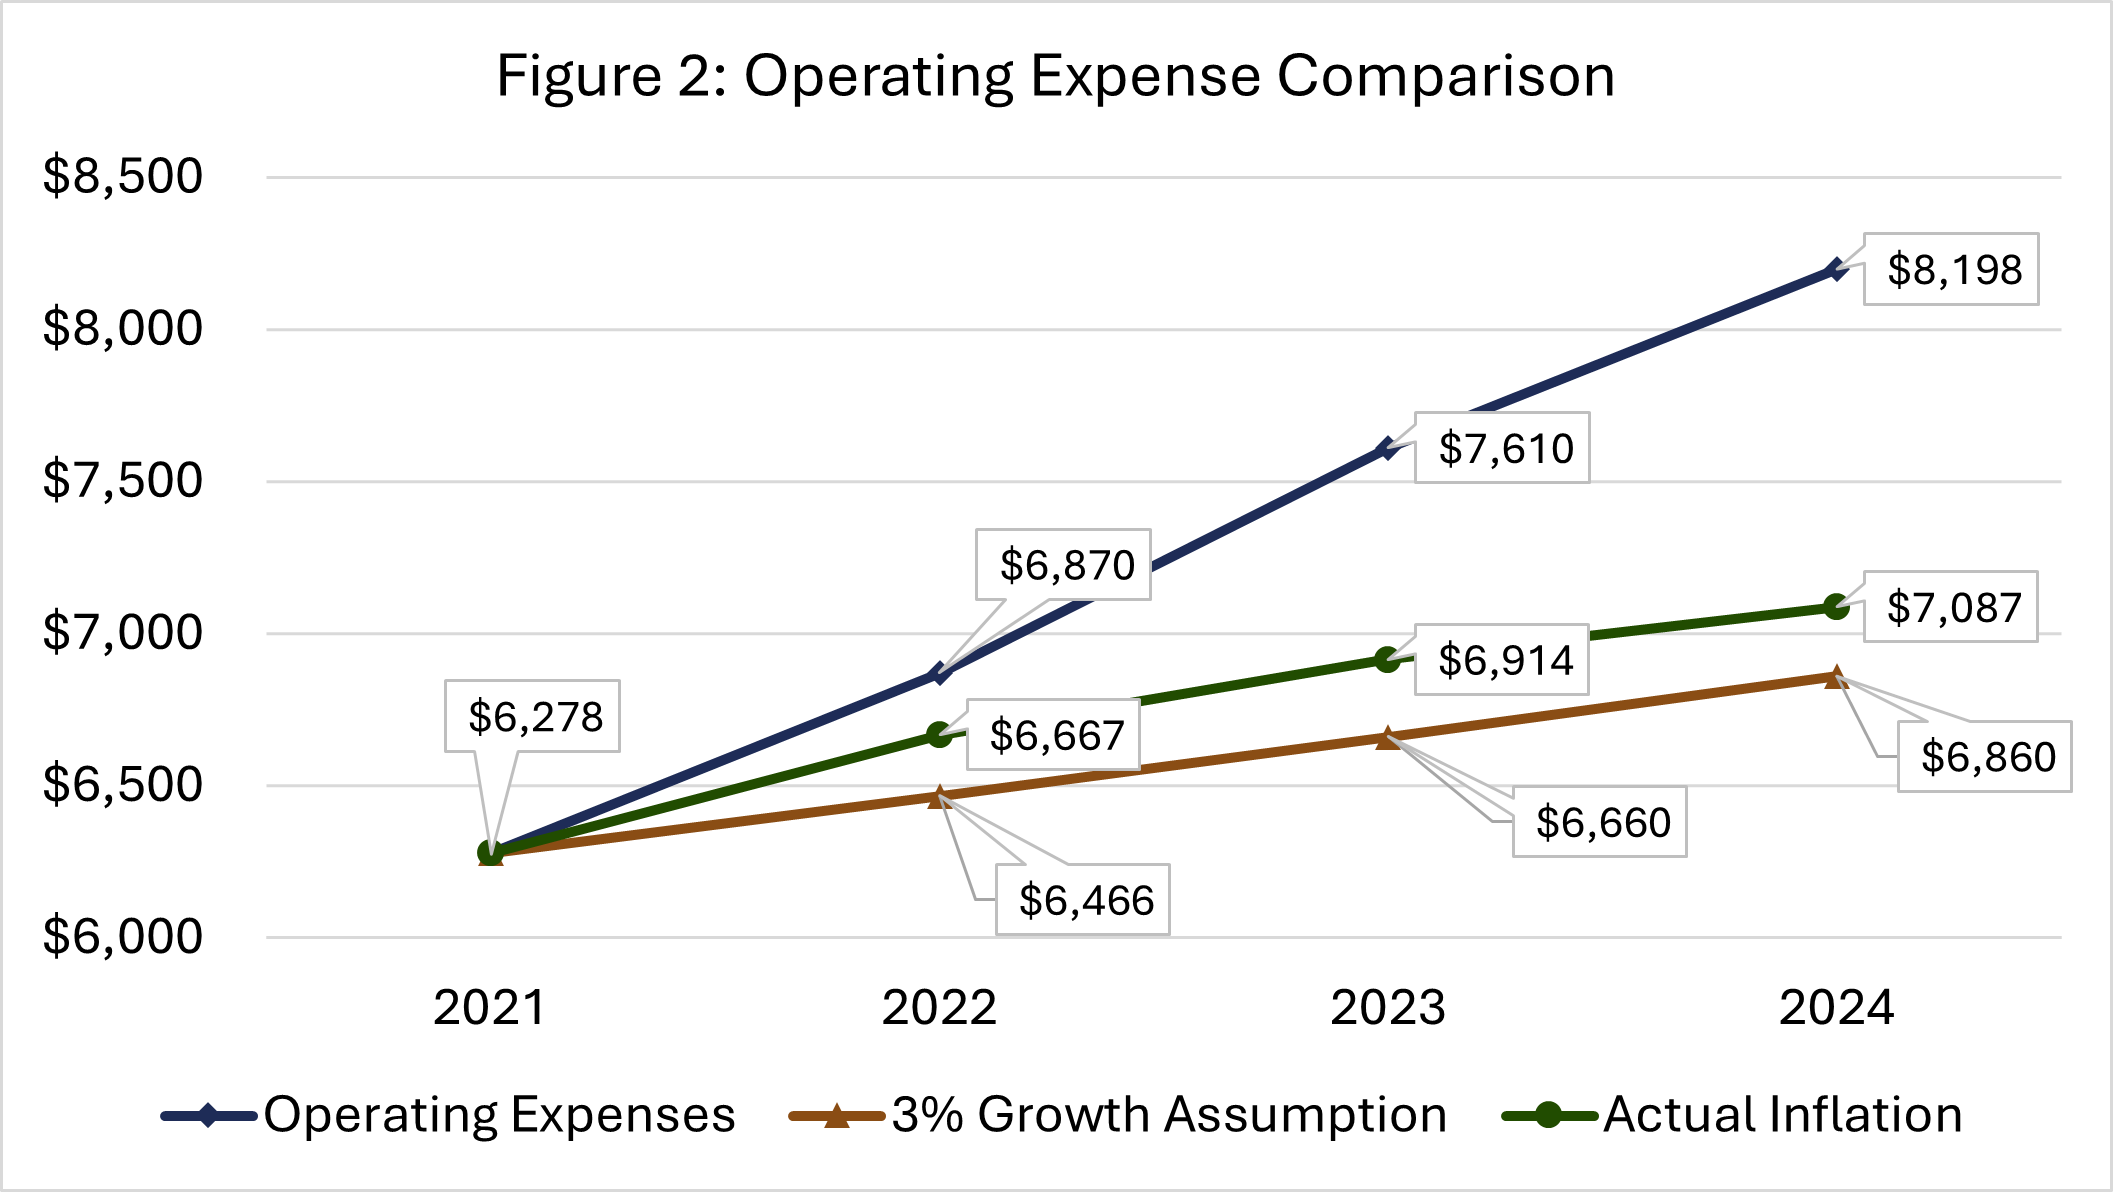
Operating Expenses: Growth Continues but Slows
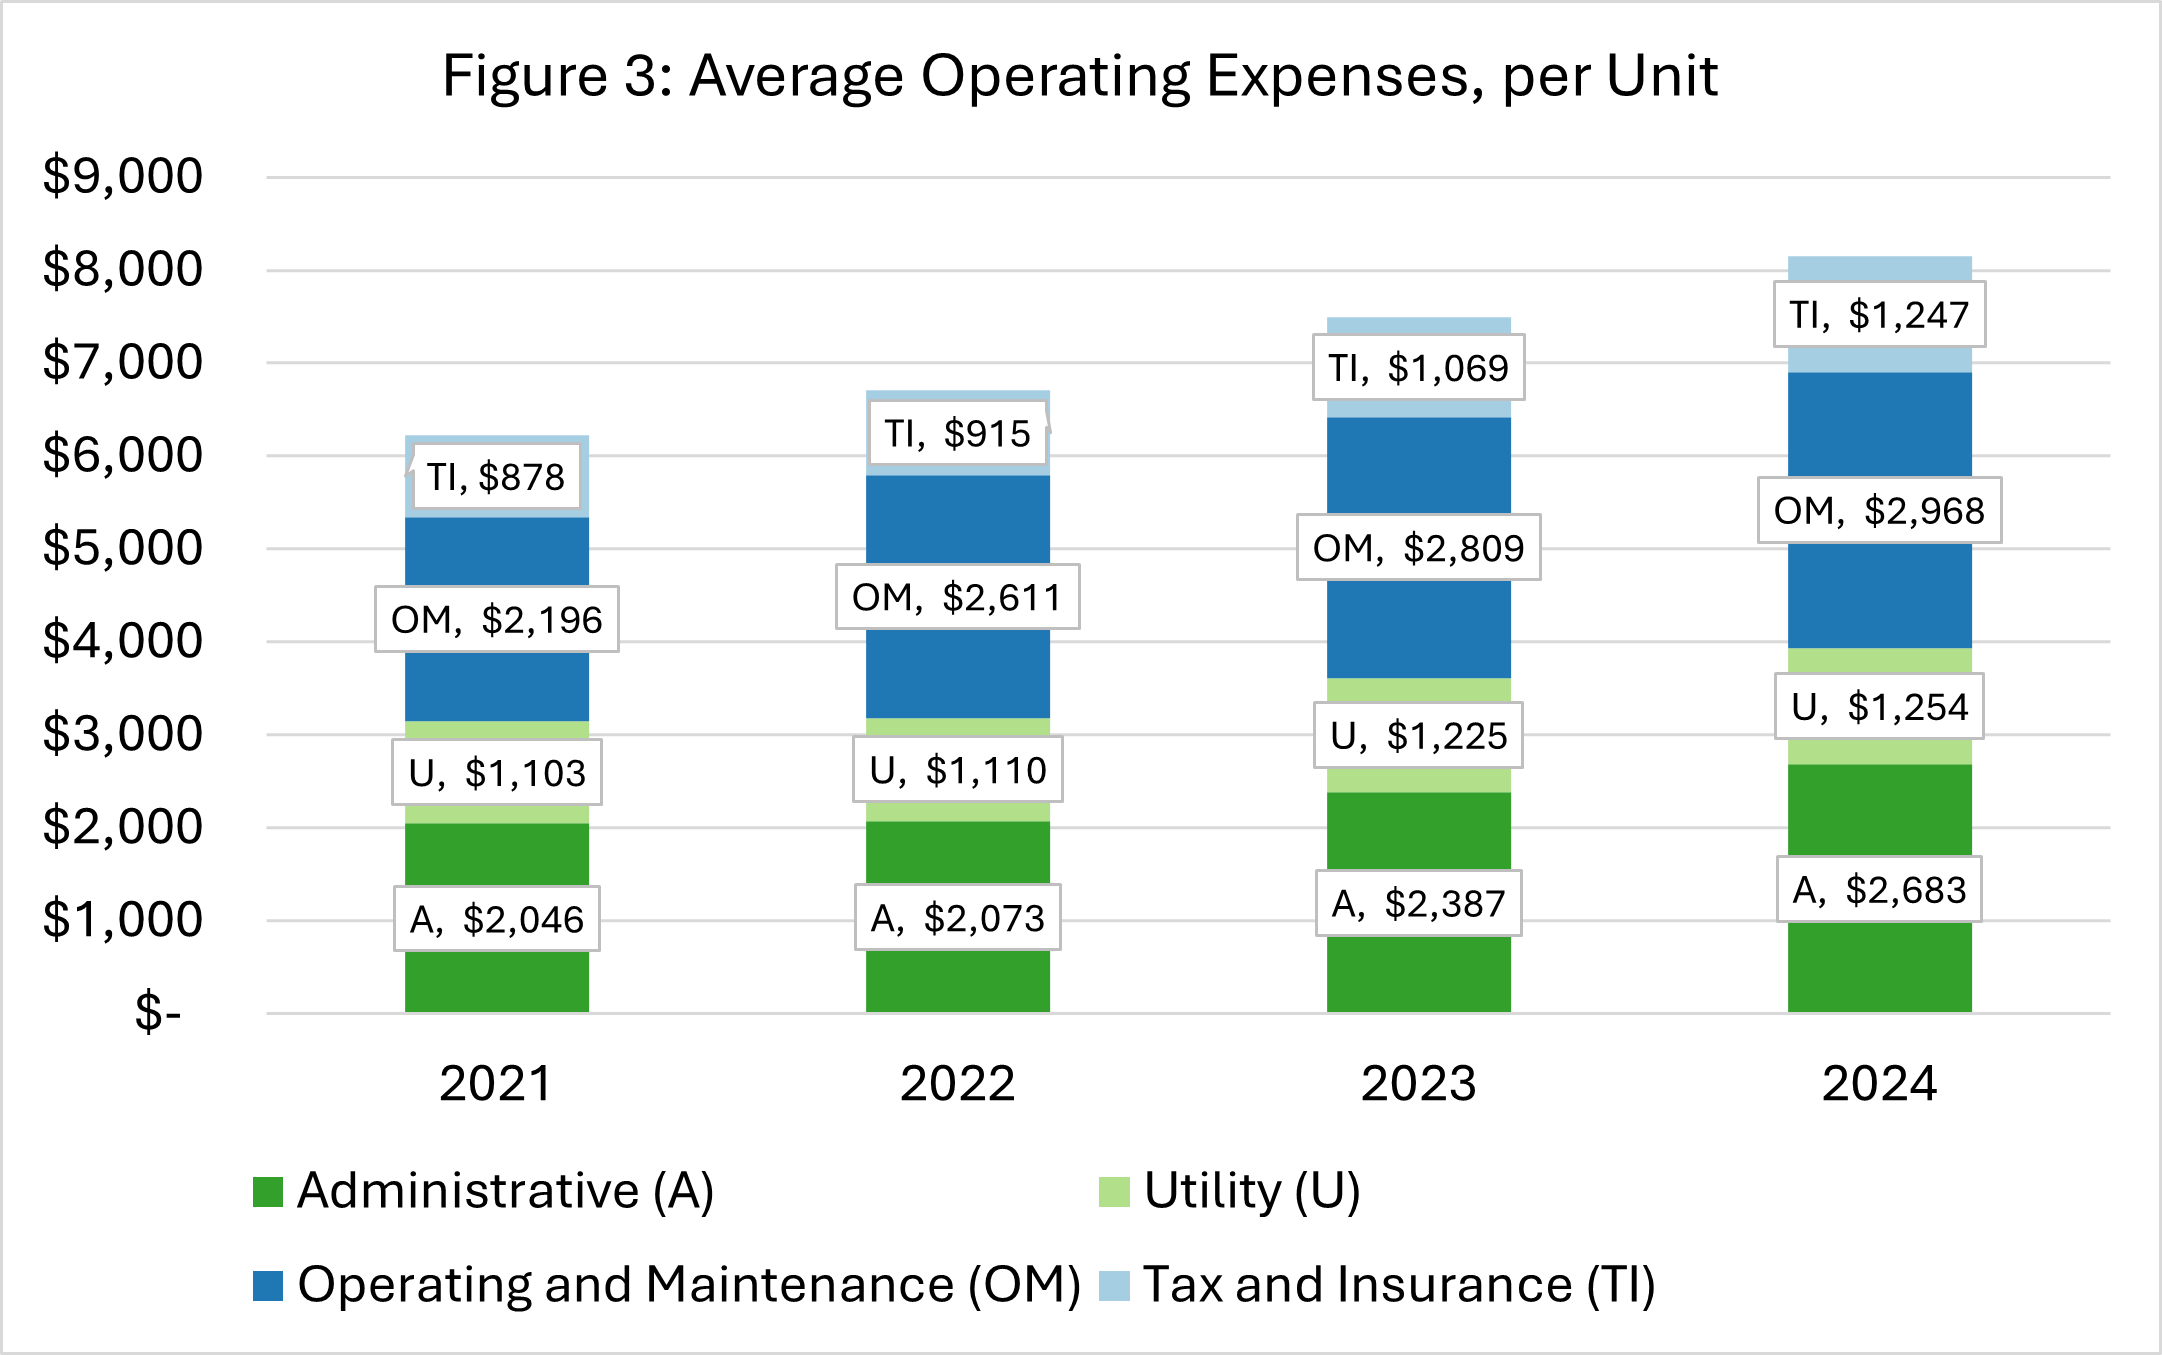
Examining the components of operating expenses highlights important trends in cost distributions across key categories. From FY21 to FY24, all major categories experienced increases, with several experiencing significant year-over-year growth. From FY23 to FY24, growth slowed for each category, with a significant slowdown in utility expenses. Operating and Maintenance remains the largest expense category. OHCS tracks one more operating expense category, Elderly Expense, that is only for properties financed with Elderly & Disabled (E&D) bonds. This category is small, affects only a limited number of properties, and is therefore excluded from this analysis.
By examining these shifts in detail, OHCS can better anticipate key cost drivers and plan more effectively for future budget needs. As additional data is incorporated each year, deeper trend analysis will further refine forecasting and strengthen strategic decision-making.
Partners expressed particular interest in management fees, bad debt, property taxes, property insurance, security, and payroll. The table below presents portfolio-wide averages, reflecting the typical financial impact across all properties, including properties with no reported expenses. The exception is property taxes: because many affordable housing properties receive exemptions, this analysis includes only those reports with a recorded property tax expense.
Notes on Table 7:
-
Property Taxes: Only includes reports with a reported property tax expense.
-
Salary: Salary line items include office salary, property manager, payroll (catchall), payroll taxes, payroll insurance
-
Property Insurance: From FY23 to FY24, property insurance increased by 24%. Put another way, property insurance accounted for 5.6% of total operating expenses in FY21, rising to 8% in FY24.
-
Security: Security costs increased by 38% from FY23 to FY24. Although still a relatively small share of total expenses, this category is growing quickly. In FY24, 45% of properties reported a security expense.
-
Bad Debt: Bad debt increased by 36% from FY23 to FY24 and more than doubled since FY21. Bad debt reflects uncollected rent from occupied units after reasonable collection efforts have failed. Partners vary in how they record bad debt—some do so after 60 days, others at 90-120 days—resulting in a natural time lag between missed rent and the recorded expense.
Non-Operating Expenses: Trends and Implications
Non-operating expenses - including depreciation, amortization, and financial costs – remained stable from FY23 to FY24, showing only minimal overall growth.
Depreciation and amortization account for the largest share of non-operating expenses. The Financial category includes debt interest and mortgage insurance, and rose significantly in FY23 by $255, or 13.9%, but fell in FY24 by $49, or -2.3%.
“Other” non operating expenses serve as a catch all category; because financial reports do not provide detail on these line items, the specific drivers are not identifiable.
Although the year over year changes are relatively modest, these shifts signal underlying financial pressures beyond day to day operations. Understanding what contributes to non-operating expenses and how they evolve over time is crucial for gaining a complete picture of the fiscal forces shaping affordable housing across the state.
Key takeaways
Operating expenses are still rising, but the pace is easing. Total operating costs increased 8% in FY24 vs. 11% in FY23 and 9% in FY22. Operating & Maintenance remains the largest cost driver, while Tax & Insurance is growing fastest over the four-year time period.