OHCS analyzed the financial performance of affordable rental housing (ARH) properties in the state’s portfolio from fiscal year (FY) 21 to FY24 to identify trends in operating expenses and understand the current reality of affordable housing property performance. Here, you'll find the patterns by geography and size.
Geography Trends
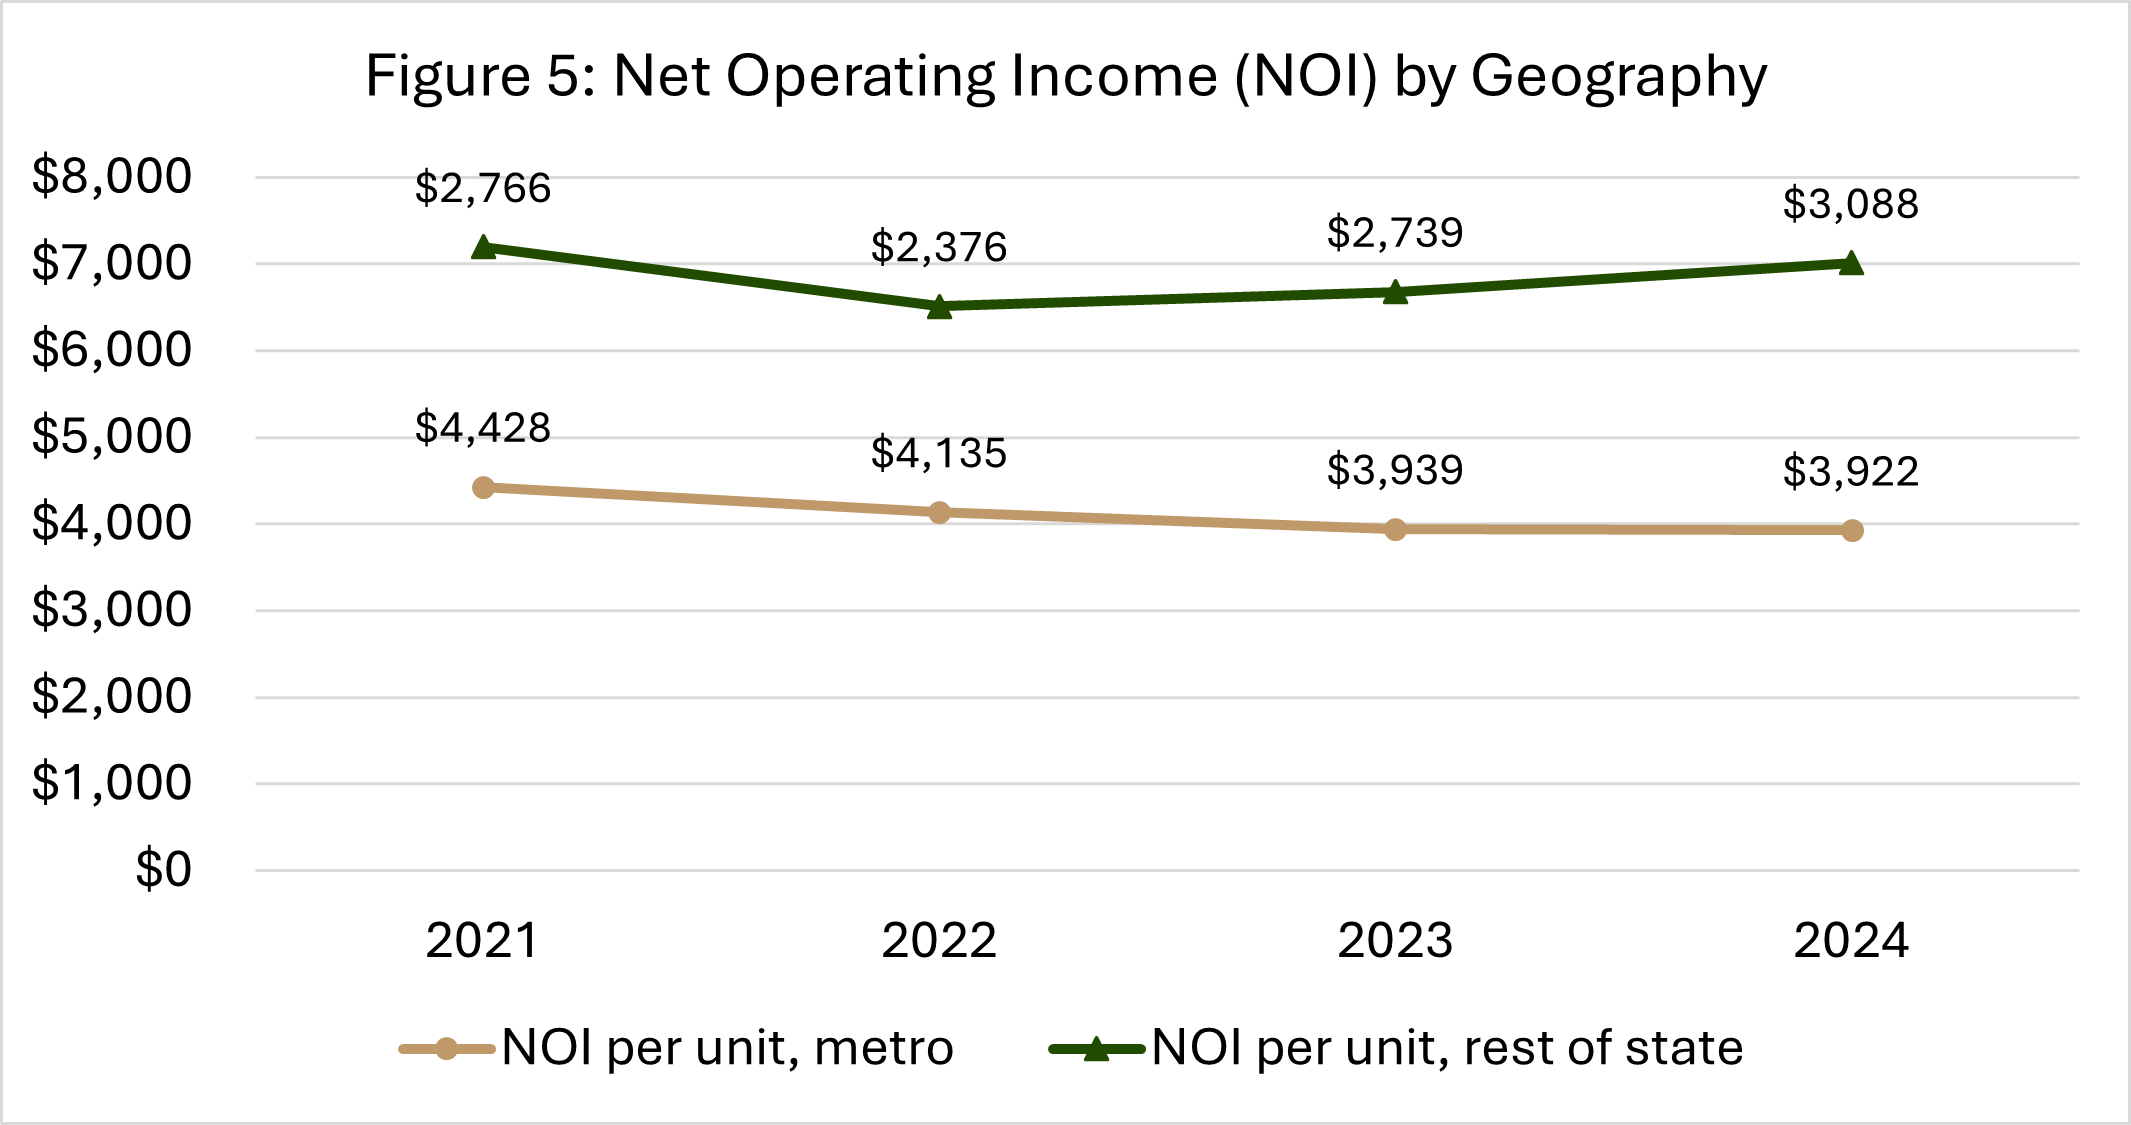
Location plays a crucial role in shaping expense trends. For this analysis, OHCS compares the Portland Metro Area – defined as Washington, Multnomah and Clackamas counties – with the rest of the state. The bar graphs below are average operating expenses per unit, and the line graphs are average NOI per unit. While operating expenses are higher in the Portland Metro, NOI is higher as well, given that revenue is higher in the Portland Metro than the rest of the state.
Figure 4: Operating Expenses by Geography
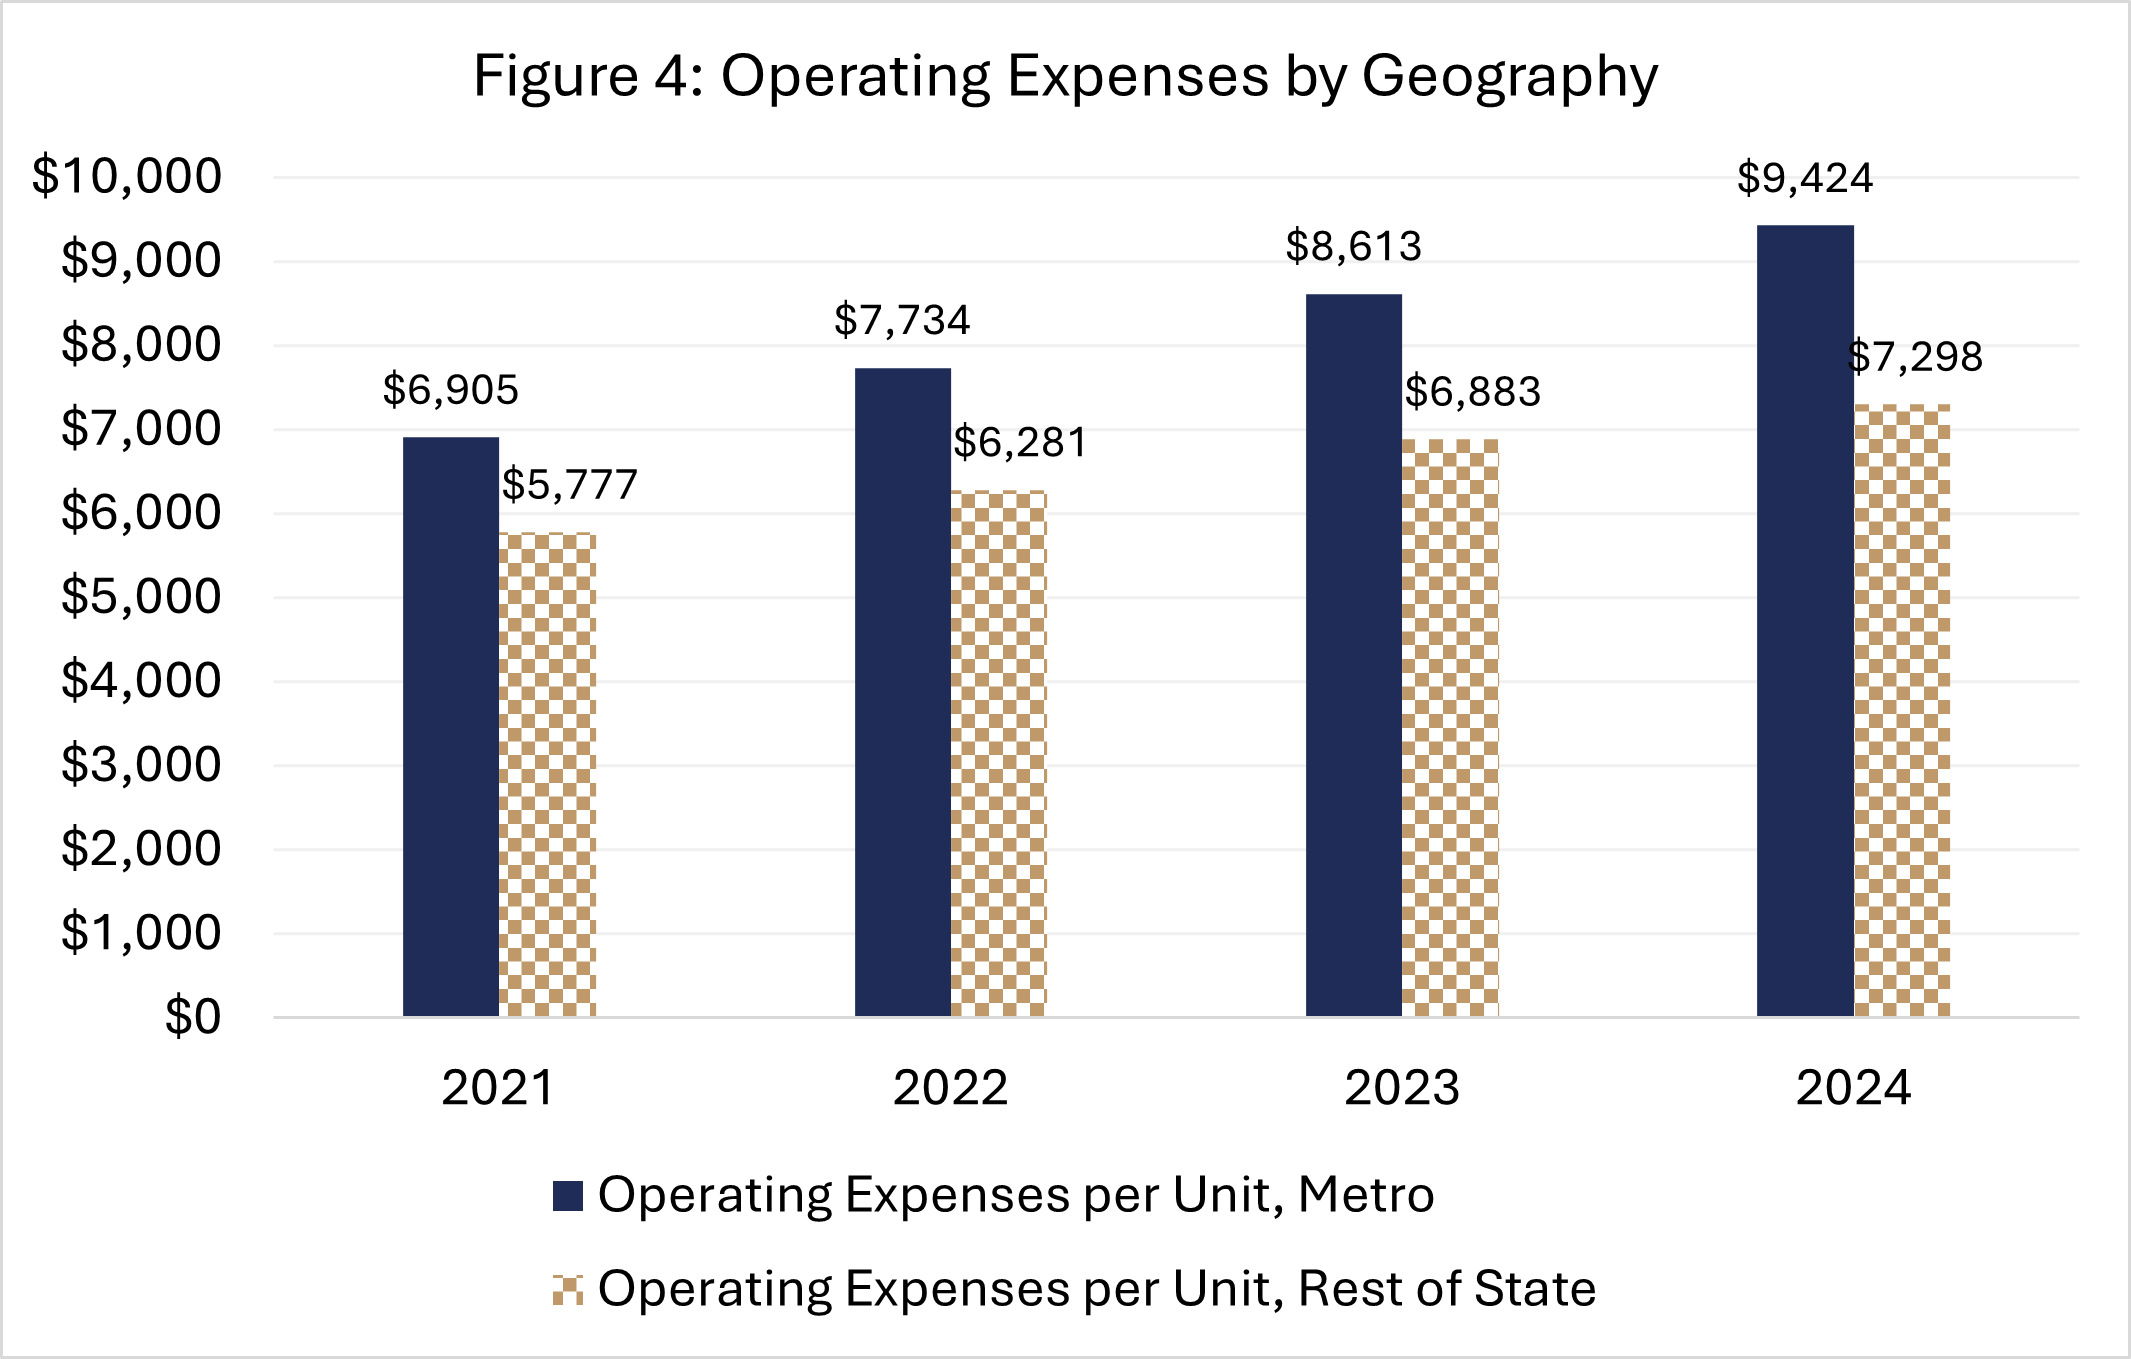
Figure 5: Net Operating Income (NOI) by Geography
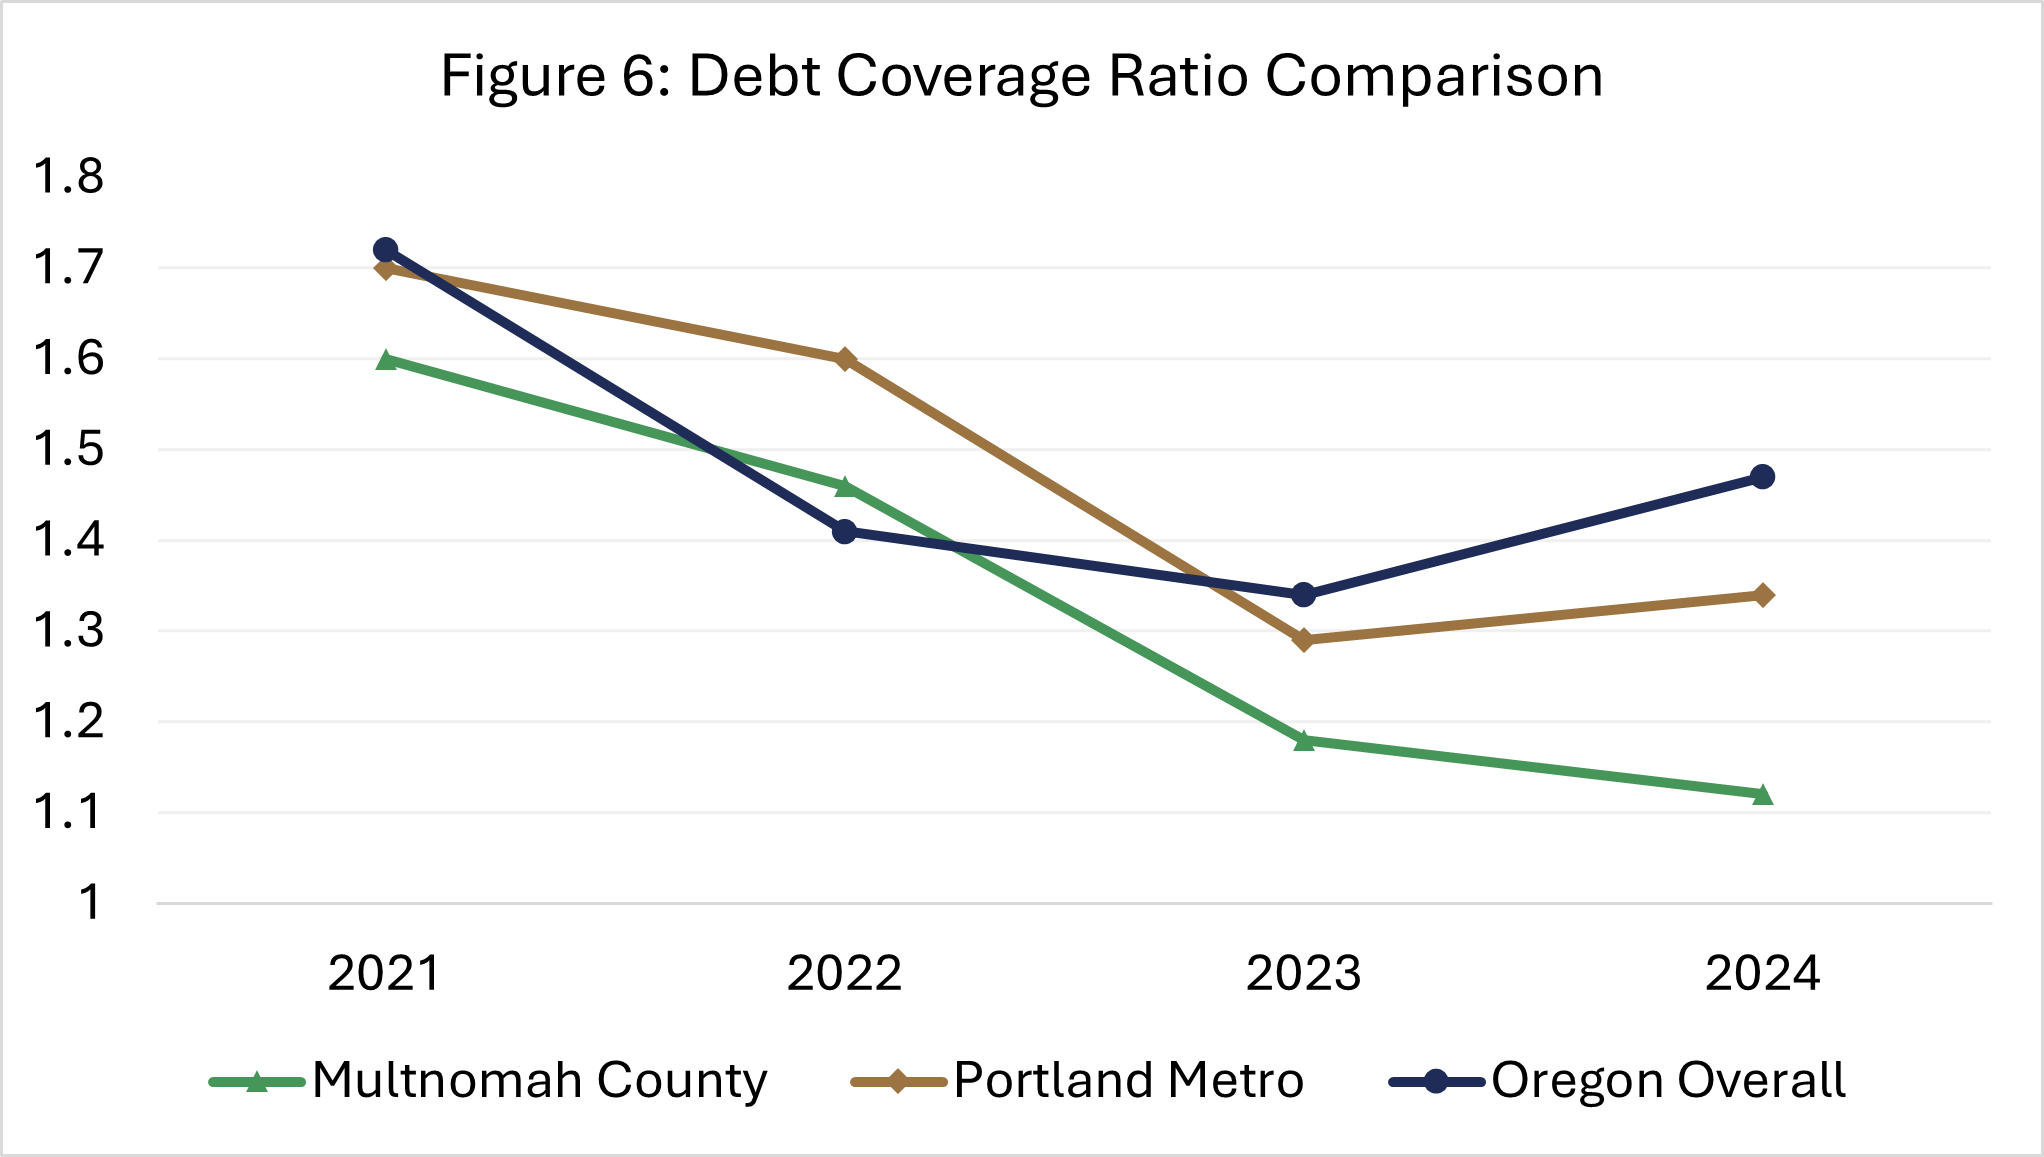
DCR statewide rose from 1.34 in FY23 to 1.47 in FY24. This upward trend is evident for the Portland Metro Area, the rest of State, and Oregon overall. Looking at just Multnomah County, DCR decreases slightly, from 1.18 in FY23 to 1.12 in FY24.
Figure 6: Debt Coverage Ratio Comparison
The overall portfolio’s vacancy loss increased from 5.4% in FY23 to 6% in FY24, largely driven by rising vacancies across the three-county Portland Metro area, which climbed from 6.5% to 7.3%. Within the Metro area, vacancy loss reached 8% in Multnomah County, 6.7% in Clackamas County, and 4.8% in Washington County. By comparison, vacancy loss in other counties was generally lower: 4.3% in Deschutes, 4.5% in Marion, 3.4% in Linn, and 5.2% in Lane.
Although the Portland Metro area reported a higher FY24 vacancy loss than both the rest of the state and Oregon overall, vacancy loss in these other areas is also increasing and doing so at a faster pace.
The online dashboard will have more location analysis, including by county. See the “Other Resources” section for more details.
Property Size Trends
To evaluate the impact of scale, OHCS divided properties into five size categories based on unit count. In all four years, the largest share of properties is between 25-49 units. Below is the breakdown of the 737 properties for 2024.
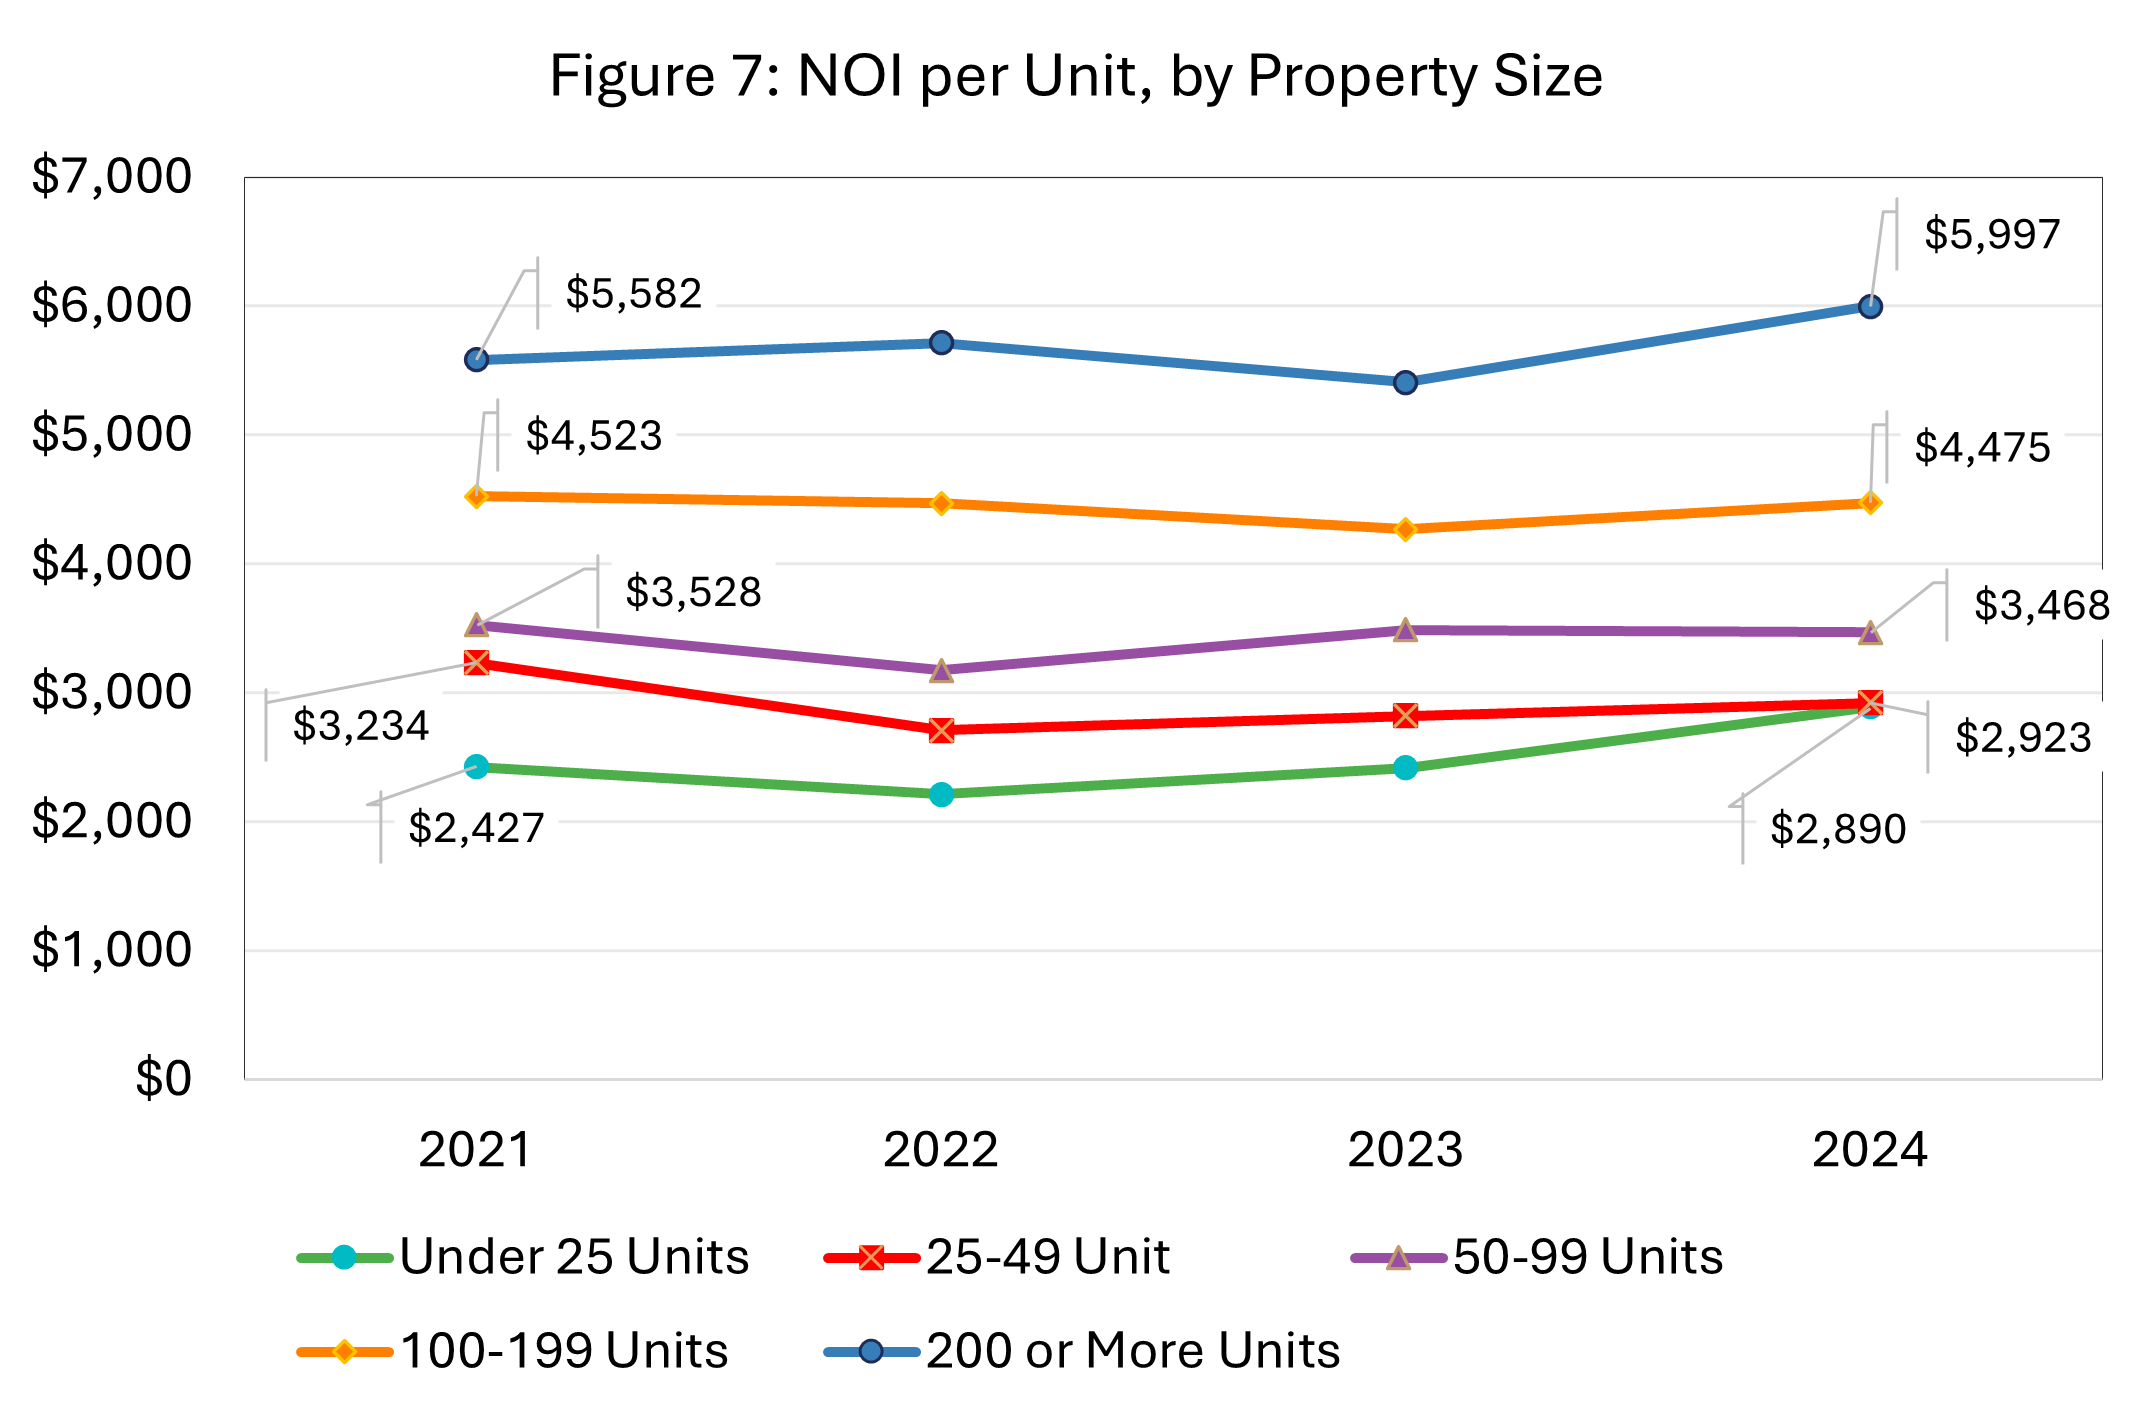
Analyzing operating expenses by property size helps identify economies of scale or challenges unique to smaller or larger developments. There is a clear trend of NOI per unit increasing as the property size increases. However, from FY23 to FY24, properties with 50-99 units saw their NOIs slightly decrease, while all other properties sizes saw their NOIs increase.
Figure 7: Net Operating Income per Unit, by Property Size
Key takeaways
In the Portland Metro area and Multnomah County specifically, properties experienced higher vacancy loss and lower debt coverage ratios compared with the rest of the state. Larger properties also demonstrated clear economies of scale, resulting in stronger net operating income performance.
Questions?
OHCS updates
the report with data on an annual basis. If you would like a print copy of the report or have questions, please email:
Oregon Housing and Community Services is committed to ensuring that all individuals have equitable access to our services, resources, and programs. If you have a disability and require assistance to read this document or would like this information in a different language, please email
Language.Access@hcs.oregon.gov.