Oregon Tuberculosis Data

In 2025, 100 cases of TB disease were reported in Oregon, corresponding to an incidence rate of 2.3 cases for every 100,000 Oregon residents. This rate is a 15.0% increase over 2024. Oregon remains a medium-incidence state for TB disease and remains below the national incidence rate.
Nationwide, the TB incidence rate remains elevated, however it did decrease slightly from 2024 with a case count of 10,260 and an incidence rate of 3.0 cases/100,000 population. These figures are a 1% decrease in cases and 2% incidence rate drop from 2024 to 2025. Please visit the CDC's Provisional 2025 Tuberculosis Data page for complete provisional US data for 2025.
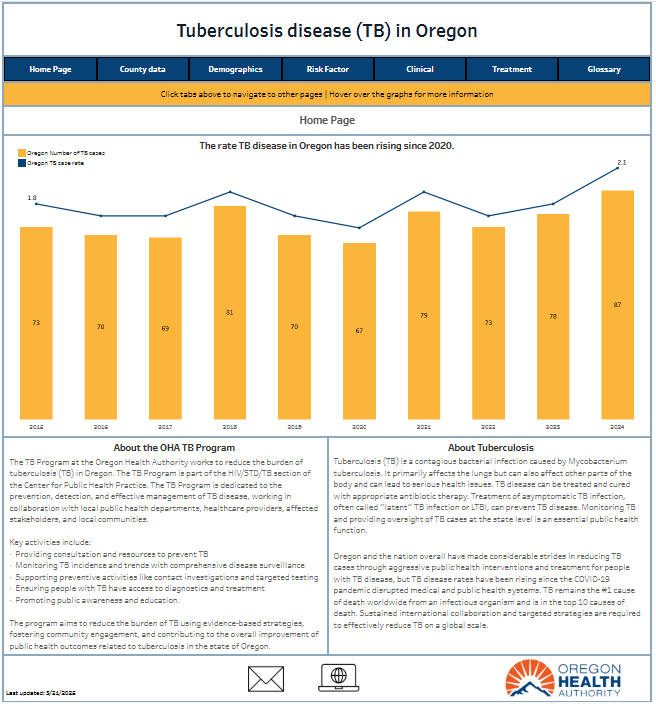
Click on the graphic below to visit the
TB Program Dashboard for complete data on TB incidence, demographics, treatment, and outcomes.
![]()