
Oregon State Flag An official website of the State of Oregon »

Oregon.gov Homepage

How to Read the At-A-Glance School Profiles

What is the At-A-Glance School Profile?

Version en español

The Every Students Succeeds Act (ESSA), signed by President Obama On December 10, 2015, was a reauthorization of our nation’s national education law (i.e., the Elementary and Secondary Education Act of 1965), and replaced and updated the No Child Left Behind (NCLB) Act of 2001. Using the flexibility afforded by ESSA, the Oregon Department of Education (ODE) created the At-A-Glance School Profile as part of a redesign of the school and district report cards. For more information on the redesign project, go to the Report Card Redesign webpage.

The creation of the At-A-Glance School Profile required ODE to engage parents from diverse backgrounds. The aim of the parent engagement campaign was to capture and honor the voices of parents from historically underserved communities so as to facilitate the display of locally meaningful and relevant information on the At-A-Glance School Profile.

All data is based on the 2023-24 school year unless otherwise noted. Exceptions include the graduation and completion rates, and teacher and principal turnover. For more detailed technical information about the At-A-Glance reports, please refer to the At-A-Glance Profile Technical Manual. In particular, the At-A-Glance Profile Technical Manual includes details on the data sources and calculations used in the report.

For more information about this topic, email Jon Wiens.

Students We Serve (page 1)

The Students We Serve section shows the school’s Student Enrollment (total student enrollment on the first school day in October in grades K-12 in 2023-24) and the percentage of students and staff by racial/ethnic group. This section also displays five critical school demographics:

  • Ever English Learners (percentage of students who have been served or were eligible for an English language development program during 2023-24 or at any time in the past)
  • Languages Spoken (unique number of home languages spoken by students)
  • Students with Disabilities (percentage of students who had an Individualized Education Program at any time during the 2023-24 school year)
  • Required Childhood Vaccinations (percentage of students with all required childhood vaccinations; data comes from the Oregon Health Authority)
  • Students Experiencing Poverty (percentage of students in Spring Membership who met any of the following criteria: received Supplemental Nutrition Assistance (SNAP) or Temporary Assistance for Needy Families (TANF); were in foster care; experienced houselessness; received migrant education services)
Students We Serve. 479 Student Enrollment. Demographics. American Indian/Alaska Native. Students <1%. Teachers 0%. Asian. Students 13%. Teachers 3%. Black/African American. Students 11%. Teachers 3%. Hispanic/Latino. Students 25%. Teachers 3%. Multiracial. Students 11%. Teachers 3%. Native Hawaiian/Pacific Islander. Students 2%. Teachers 0%. White. Students 38%. Teachers 86%. 30% Ever English Learners. 25 Languages Spoken. 18% Students with Disabilities. 89% Required Childhood Vaccinations. 49% Students Experiencing Poverty. * <10 students or data unavailable.

Our Staff (page 2)

The Our Staff section shows the adjusted full-time equivalent (FTE) of Teachers, Educational Assistants, and Counselors/Psychologists/Social Workers in the school. FTE is a conversion of hours worked to a standardized and comparable measure of staff workload. For instance, FTE of two could reflect two full-time teachers or four half-time teachers.

A teacher is defined as a teacher, head teacher, special education teacher, or special education physical education teacher.

This section also displays the Average Teacher Retention Rate (the three-year average of the percentage of teachers employed at a school that return to the school in at least one of the two the following years) and whether the school has had the same principal during the last three school years. The Teacher Experience measure is also reported as the “percentage of licensed teachers with more than three years of experience” (it is calculated by dividing the number of teachers who are licensed with more than 3 years of experience teaching in Oregon and outside of Oregon by the total number of Teachers who are licensed in the school).

Our Staff (rounded FTE) 26 Teachers. 17 Educational assistants. 1 Counselors/Psychologists/Social Workers. 95% Average teacher retention rate over the past three years. 88% % of licensed teachers with more than 3 years of experience. Yes Same principal in the last 3 years.


School Environment (page 1)

The School Environment section shows the Class Size (median class size for the school) and Regular Attenders (percent of students who attended more than 90 percent of their enrolled school days). The median gives an estimate of the average class size for the school. This section also shows the Oregon state average and the calculated change from the school’s previous year for each indicator.

School Environment. Class Size. Median class size. 20. No change from previous year. Oregon average 22. Regular Attenders. Students who attended more than 90% of their enrolled school days. 70%. Increase from previous year 5%. Oregon average 66%.


Academic Progress (page 1)

The Academic Progress section varies by school type (elementary/middle or high school).

High School

The Academic Progress section for high schools shows the On-Track to Graduate (ninth grade on-track). This is the percentage of students that have earned at least one quarter of their required credits for graduation in their first year of high school. This section also shows the Oregon state average and the percent change from the school’s previous year.

Academic Progress. On-track to graduate. Students earning one-quarter of graduation credits in their 9th grade year. 76%. Increase from previous year 1%. Oregon average 85%. 


Academic Success (page 1)

The Academic Success section varies by school type (elementary/middle or high school).
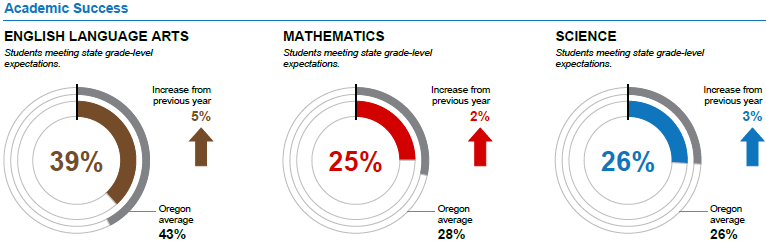
Elementary/Middle

The Academic Success section for elementary and middle schools includes English Language Arts, Mathematics, and Science assessment results. This section also shows the Oregon state average and the percent change from the school’s previous year for each subject. Note that the state average shown is the state percentage for the grades served by the school. For example, for a school serving grades K-5, the state average would be the state average for grades 3-5.
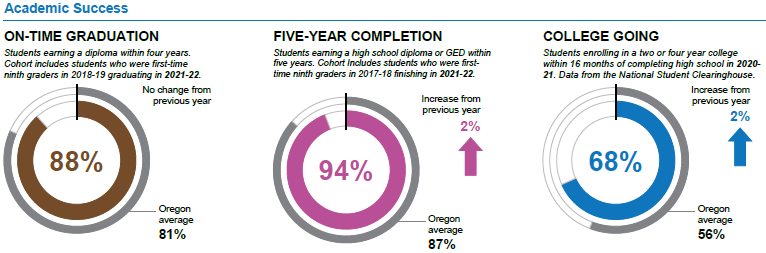
Academic Success. English Language Arts. Students meeting state grade-level expectations. 47%. Increase from previous year 2%. Oregon average 43%. Mathematics. Students meeting grade-level expectations. 39%. Increase from previous year 9%. Oregon average 37%. Science. Students meeting state grade-level expectations. 43%. Increase from previous year 1%. Oregon average 31%.

High School

The Academic Success section for high schools and combined schools shows On-Time Graduation (four-year graduation rate), Five-Year Completion, and College Going. The College Going rate is the percentage of On-Time graduates who enroll in a postsecondary institution after graduating and within 12 months following the cohort’s graduation. This section also shows the Oregon state average and the percent change from the school’s previous year for On-Time Graduation and Five-Year Completion.

Academic Success. On-Time Graduation. Students earning a diploma within four years. Cohort includes students who were first time ninth graders in 2019-20 graduating in 2022-23. 89%. Increase from previous year 2%. Oregon average 81%. Five-year Completion. Students earning a high school diploma or GED within five years. Cohort includes students who were first-time ninth graders in 2018-19 finishing in 2022-23. 94%. Decrease from previous year 3%. Oregon average 87%. College Going. Students enrolling in a two or four year college within 12 months of completing high school in 2021-22. Data from the National Student Clearinghouse. 82%. Oregon average 53%.


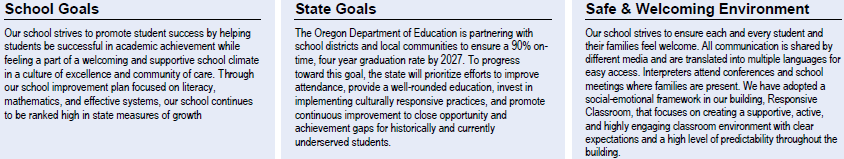
School and State Goals, and Safe & Welcoming Environment (page 1)

The Oregon Department of Education (ODE) provides the State Goals section. The School Goals section is for schools to provide local context regarding the school’s priorities or goals for serving their students. The Safe & Welcoming Environment section is for schools to describe actions taken or resources used to create a safe, welcoming, and inclusive environment for all students and their families. Both the School Goals and the Safe & Welcoming Environment sections are submitted to ODE by school and district staff.

School Goals. Our school promotes student success by using a clear and consistent, culturally responsive system of support. This system utilizes data to identify and address student attendance, behavior, and academic concerns. Student success is consistently monitored and interventions are implemented. State Goals. The Oregon Department of Education is partnering with school districts and local communities to ensure a 90% on-time, four year graduation rate by 2027. To progress toward this goal, the state will prioritize efforts to improve attendance, provide a well-rounded education, invest in implementing culturally responsive practices, and promote continuous improvement to close opportunity and achievement gaps for historically and currently underserved students. Safe & Welcoming Environment. Our school strives to ensure all students feel welcome and informed. We support students around the importance of positive peer relationships and positive relationships with staff. To reach as many families as possible, a Spanish and Russian liaison are available during the school day and communications are translated and sent home in English, Spanish and Russian. To ensure the safety of our students, our school continually reflects on safety protocols and utilizes outside experts to provide recommendations for improvement.


Outcomes (page 2)

The Outcomes section varies by school type (elementary/middle or high school).

Elementary/Middle

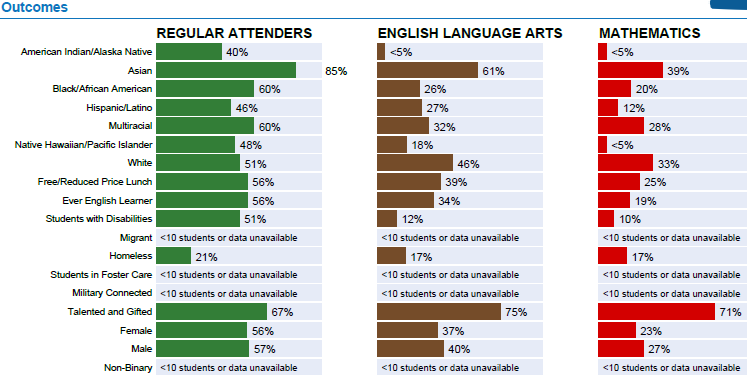
The Outcomes section for elementary and middle schools shows data for Regular Attenders, English Language Arts, and Mathematics, disaggregated by eighteen student groups.

Outcomes section of the At-A-Glance report for Elementary/Middle school
Outcomes
Student GroupRegular
Attenders
English
Language Arts
Mathematics
American Indian/Alaska Native<10 students or data unavailable<10 students or data unavailable<10 students or data unavailable
Asian87%57%53%
Black/African American59%32%29%
Hispanic/Latino62%40%18%
Multiracial70%46%33%
Native Hawaiian/Pacific Islander<10 students or data unavailable<10 students or data unavailable<10 students or data unavailable
White71%62%59%
Students Experiencing Poverty56%31%20%
Ever English Learner66%30%30%
Students with Disabilities61%22%22%
Migrant<10 students or data unavailable<10 students or data unavailable<10 students or data unavailable
Homeless30%<10 students or data unavailable<10 students or data unavailable
Students in Foster Care<10 students or data unavailable<10 students or data unavailable<10 students or data unavailable
Military Connected<10 students or data unavailable<10 students or data unavailable<10 students or data unavailable
Talented and Gifted>95%>95%>95%
Female66%53%39%
Male70%47%43%
Non-Binary<10 students or data unavailable<10 students or data unavailable<10 students or data unavailable

High School

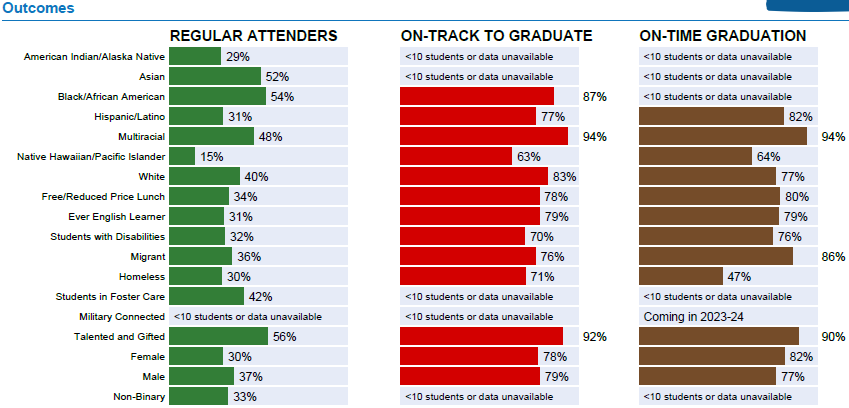
The Outcomes section for high schools shows data for Regular Attenders, On-Track to Graduate (Ninth Grade On-Track), and On-Time Graduation (four-year graduation rate), disaggregated by eighteen student groups.

Outcomes section of the At-A-Glance report for high schools
Outcomes
Student GroupRegular
Attenders
On-Track To
Graduate
On-Time
Graduation
American Indian/Alaska Native36%<10 students or data unavailable<10 students or data unavailable
Asian78%92%86%
Black/African American53%67%70%
Hispanic/Latino52%76%67%
Multiracial59%76%80%
Native Hawaiian/Pacific Islander24%25%69%
White56%75%74%
Students Experiencing Poverty46%65%66%
Ever English Learner59%76%72%
Students with Disabilities50%65%60%
Migrant40%<10 students or data unavailable<10 students or data unavailable
Homeless24%46%54%
Students in Foster Care55%<10 students or data unavailable<10 students or data unavailable
Military Connected<10 students or data unavailable<10 students or data unavailable<10 students or data unavailable
Talented and Gifted82%>95%>95%
Female56%78%79%
Male59%74%70%
Non-Binary61%83%<10 students or data unavailable


About Our School (page 2)

The About Our School section varies by school type (elementary/middle or high school) and is submitted to ODE by school and district staff.

Elementary/Middle

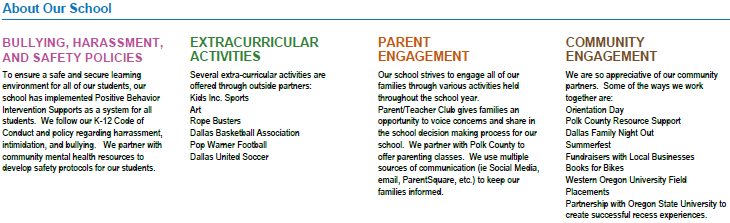
For elementary and middle schools, this section has headings for Bullying, Harassment, and Safety Policies; Extracurricular Activities; Parent Engagement; and Community Engagement. The Bullying, Harassment, and Safety Policies subsection contains a summary of the school’s efforts to address bullying and harassment and promote safety. The Extracurricular Activities subsection describes student access to or key resources related to extracurricular activities. The Parent Engagement subsection describes actions taken or key resources used by schools to engage parents. The Community Engagement subsection describes actions taken or key resources used by schools to engage community members.

About Our School. BULLYING, HARASSMENT, AND SAFETY POLICIES. To ensure a safe and secure learning environment for all of our students, our school has implemented Positive Behavior Intervention Supports as a system for all students. We follow our K-12 Code of Conduct and policy regarding harrassment, intimidation, and bullying. We partner with community mental health resources to develop safety protocols for our students. EXTRACURRICULAR ACTIVITIES. Several extra-curricular activities are offered through outside partners: Kids Inc. Sports. Art. Rope Busters. Dallas Basketball Association. Pop Warner Football. Dallas United Soccer. PARENT ENGAGEMENT. Our school strives to engage all of our families through various activities held throughout the school year. Parent/Teacher Club gives families an opportunity to voice concerns and share in the school decision making process for our school. We partner with Polk County to offer parenting classes. We use multiple sources of communication (ie Social Media, email, ParentSquare, etc.) to keep our families informed. COMMUNITY ENGAGEMENT. We are so appreciative of our community partners. Some of the ways we work together are: Orientation Day. Polk County Resource Support. Dallas Family Night Out. Summerfest. Fundraisers with Local Businesses. Books for Bikes. Western Oregon University Field Placements. Partnership with Oregon State University to create successful recess experiences.

High School

For high schools, this section has headings for Advanced Coursework; Career & Technical Education; Extracurricular Activities; and Parent & Community Engagement. The Advanced Coursework subsection lists the school’s advanced courses available to students. The Career & Technical Education subsection includes the Career and Technical Education (CTE) courses offered to students or key resources related to CTE. The Extracurricular Activities subsection describes student access to or key resources related to extracurricular activities. The Parent & Community Engagement subsection describes actions taken or key resources used by schools to engage parents and community members.

About Our School. ADVANCED COURSEWORK. · Our school offers many college courses. Highlights Include: •Biology, Physics, Chemistry, US History, World History. Our School offers a number of advanced language courses: •Spanish, Spanish for Native Speakers, French, German. We also offer dual-enrollment courses through the local community college. Highlights include: •Chemistry, English, US History. CAREER & TECHNICAL EDUCATION. Our students have the option of enrolling in a variety of CTE courses where students can earn dual credit and receive college credit: •Digital Design. •Manufacturing. •Web Design. •Welding. •Food Science. •Diesel Mechanics. •Industrial Maintenance. EXTRACURRICULAR ACTIVITIES. Our school offers several academic focused extracurricular activities: •Yearbook Team. •National Honors Society. •College Classes. Our school offers OSAA athletics, visit our school website for more details. PARENT & COMMUNITY ENGAGEMENT. Our school engages our parents and community by hosting a variety of events intended for parents and community members to attend: •First Day Open House. •May Day. •Homecoming. •College Academy. •Career Fair. •Parent’s Club. Our school also partners with local business to create internship opportunities for senior students.


Back to Top

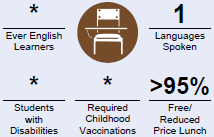
What do the symbols mean?

There are three different types of symbols that can appear on the profiles:

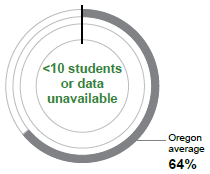
  • The less than symbol <
    • This could appear, for example, in the phrase “< 10 students or data unavailable” which occurs whenever the total number of students available for a measurement is less than 10 students. Two examples where this occurs are shown in the following images.
      Part of the At-A-Glance where the less than symbol appears. The language in the image says 'less than 10 students or data unavailable', where less than is represented by the symbol.
      At-A-Glance dial where the less than symbol appears. The center of the dial reads 'less than 10 students or data unavailable'. There is also surrounding text for the dial that reads 'Oregon average 64%.'
  • The greater than symbol >
    • This could appear in front of a percentage to communicate that the actual value is greater than the percentage.
  • The asterisk symbol *
    • This could also appear when the total number of students available for a measurement is less than 10 students or the data are unavailable. To protect confidential student information from being revealed, the asterisk appears in place of the percentage.
      * Ever English Learners. 1 Languages Spoken. * Students with Disabilities. * Required Childhood Vaccinations. * Students Experiencing Poverty.